
FIG. 8.
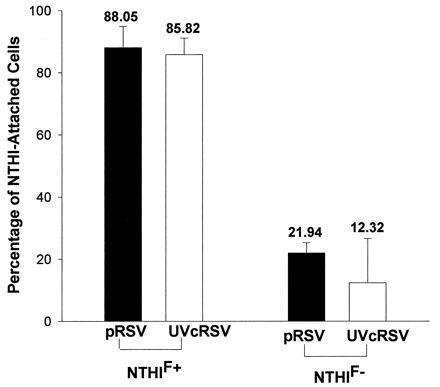
Percentages of pRSV-exposed (MOI = 1, 24 h) and UV-cRSV-exposed (1:2 dilution, 24 h) A549 cells demonstrating attached NTHIF+ or NTHIF− (A549:NTHI = 1:100), as determined by flow cytometry. The values are means of four experiments.
Official websites use .gov
A
.gov website belongs to an official
government organization in the United States.
Secure .gov websites use HTTPS
A lock (
) or https:// means you've safely
connected to the .gov website. Share sensitive
information only on official, secure websites.
Percentages of pRSV-exposed (MOI = 1, 24 h) and UV-cRSV-exposed (1:2 dilution, 24 h) A549 cells demonstrating attached NTHIF+ or NTHIF− (A549:NTHI = 1:100), as determined by flow cytometry. The values are means of four experiments.