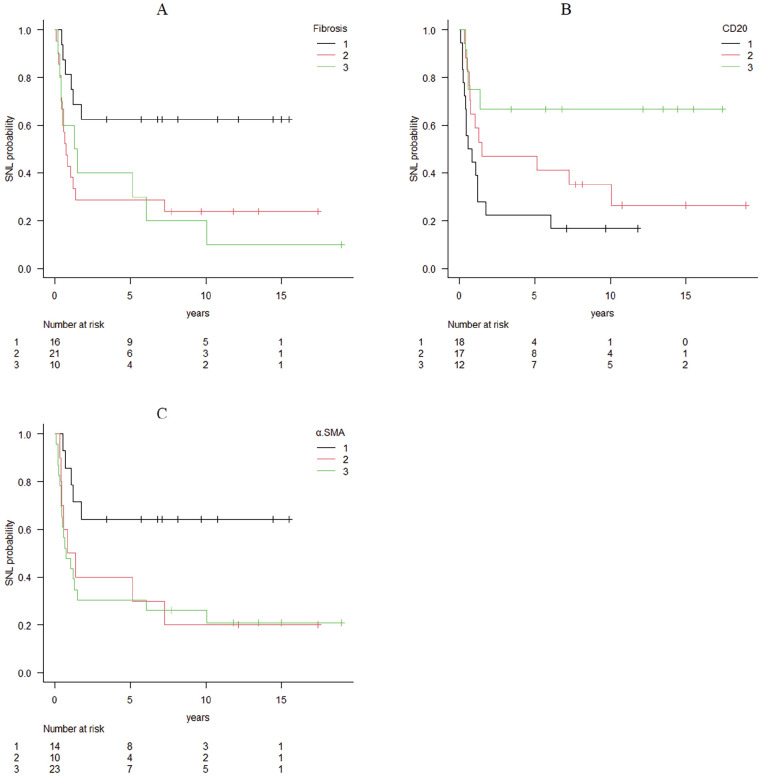
Figure 3.
(A) Survival curve for fibrosis. (B) Survival curve for CD20 expression. (C) Survival curve for α-SMA expression. Survival curves for the 3 parameters that showed significant correlations in the log rank tests of the relationships between each histopathological and immunohistochemical parameter and the prevalence of SNL. Liver fibrosis and α-SMA expression showed negative correlations with SNL, whereas CD20 showed a positive correlation. There were no significant relationships of other parameters with SNL.

