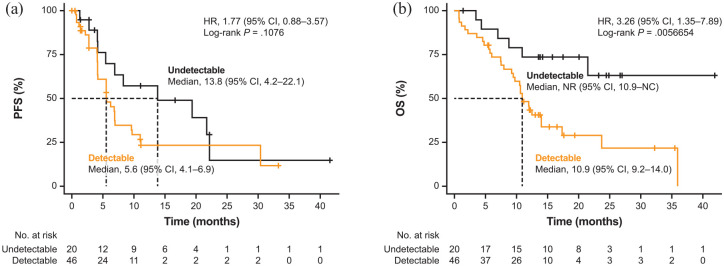
Figure 2.
Kaplan–Meier survival curves for (a) PFS and (b) OS by METex14 ctDNA status at baseline.
CI, confidence interval; ctDNA, circulating tumour DNA; HR, hazard ratio; METex14, MET exon 14 skipping alteration; NC, not calculable; NR, not reached; OS, overall survival; PFS, progression-free survival.

