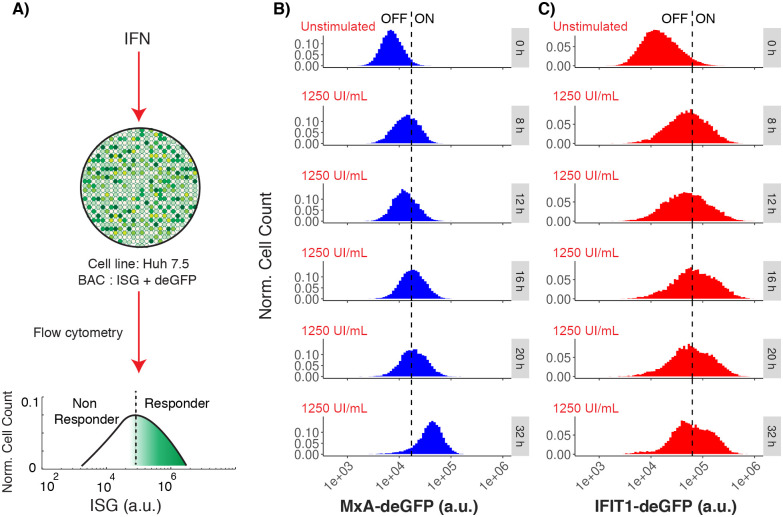
Fig 2. ISG induction after IFN stimulation.
A: Experimental set-up showing the graded expression of MxA and IFIT1 after IFN-α stimulation in a population of Huh7.5 cells. A threshold is defined to differentiate responder vs. non-responder cells in the population. B: Distributions represent the flow cytometry measurements of MxA expression at different time points after IFN stimulation (blue distribution). C: Distributions represent the flow cytometry measurements of IFIT1 expression at different time points after IFN stimulation (red distribution). In figures B and C, the vertical dashed lines represents a threshold value (defined as the mean plus two standard deviations) calculated form the unstimulated populations. This threshold value is used to differentiate responser vs non-responder cells in a cell population with a graded response. In the observed treatments, the mean fluorescence level shifts from 8x10³ a.u. (arbitrary units of fluorescence) to 4.5x10⁴ a.u. for MxA, and from 2x10⁴ to 9x10⁴ a.u. for IFIT1.

