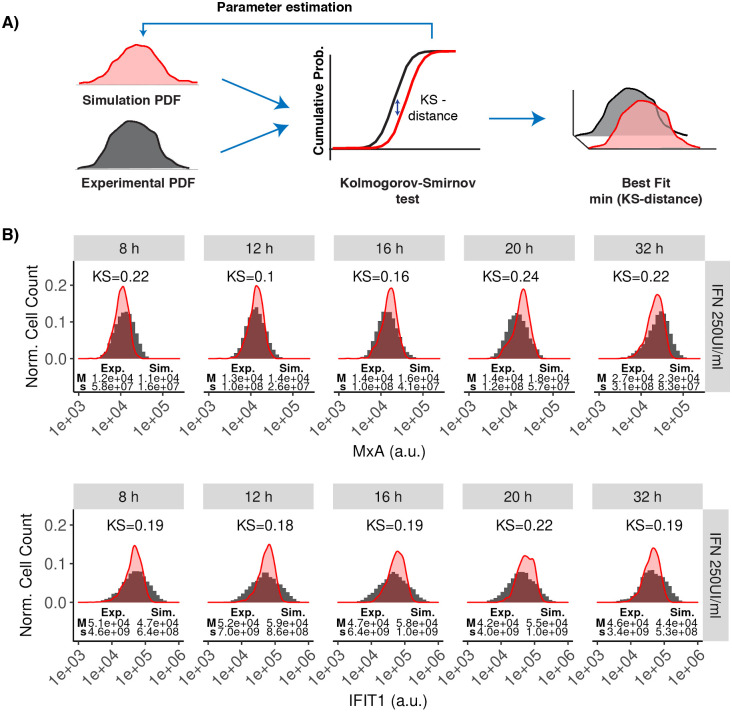
Fig 3. Fitting single-cell data to the stochastic model.
A: The parameter estimation strategy consist of optimization routines based on genetic algorithms. The proposed methods measure the similitude between experimental and simulated distributions using KS-distance. The best parameters are obtained by minimizing the KS-distance. The full strategy for parameter estimation is given in the Section C in S1 Text. B: Experimental time-dependent distributions were computed from the flow cytometry datasets (filled histograms). Simulated time-dependent distributions were computed by solving our model under stochastic dynamics and repeating the simulations 1,000 times (red density plots). In the plots, the y-axis represents the normalized cell count and the x-axis represents the fluorescence quantity (arbitrary units, a.u.) associated with the expression of the MxA and IFIT1 proteins at various time points after stimulating Huh7.5 cells with 250 UI/mL IFN (5,000 IFN molecules). For each distribution, the median (M) and variance (s) is given. The initial conditions are given in Table 1, fitted parameter values are given in Table 2 and compartment sizes are given in Table 3. See Figs H and I in S1 Text for fits using different IFN doses.

