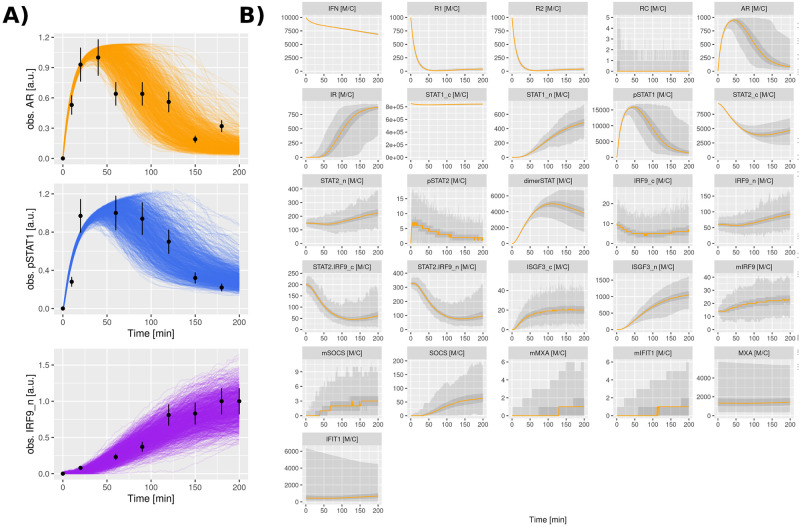
Fig 4. Model temporal dynamics and cell population data.
A: Cell population data describing the temporal dynamics of phosphorylated JAK1, pSTAT1 and nuclear IRF9. Experimental data describe quantitative immunoblotting measurements in Huh7.5 cells after stimulation with 500 UI/mL of IFN-α at different time points for a total time of 180 min [4]. Measurement error of 18% is represented in the figures as error bars. Model dynamics were obtained by repeating the stochastic simulation 1,000 times, each trajectory representing a single cell. The procedure for mapping the model variables and experimental data is given in Section C.1 in S1 Text. B: Time courses data describing the temporal dynamics of all species involved in the JAK-STAT signaling pathway. The plots represent the repetitions of the stochastic model. The y-axis has units of Molecules per Cell (M/C). Orange lines represent the median, while light gray display the range of values and dark gray ribbons contain 50% of the values. The ribbons may not be visible if there is almost no variation (e.g. IFN) or if there is no particle present for the majority of trajectories (e.g. mIRF9n).

