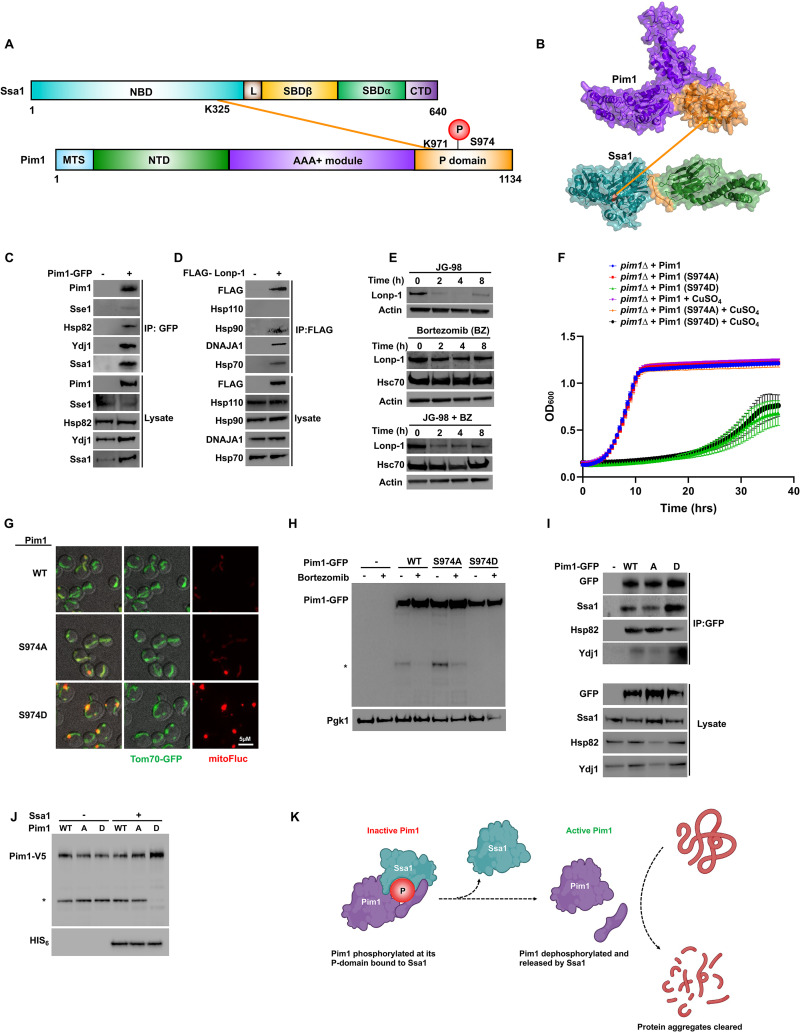
Fig 5. Activity of Pim1/Lonp-1 is regulated by interaction with Hsp70 and a novel phosphorylation site, S974.
(A) Schematic representation of Ssa1-Pim1 inter protein cross-links detected on NBD of Ssa1 and proteolytic domain of Pim1. (B) Ssa1-Pim1 cross-links mapped on the crystal structures of Pim1 and Hsp70. (C) Pim1 interacts with the chaperone complex in yeast cells. Yeast expressing Pim1-GFP were grown to mid-log phase and Pim1-GFP complexes were isolated using GFP-TRAP beads. The purified Pim1-GFP complex was analyzed by SDS-PAGE/western blot analysis using indicated antisera. (D) Lonp-1 interacts with chaperone complexes in mammalian cells. HEK293 cells were transfected with a FLAG-Lonp-1 construct and after 24 h, total protein was extracted and FLAG-Lonp-1 complexes were isolated using FLAG Dynabeads. FLAG-Lonp-1 complexes were analyzed by SDS-PAGE/western blot using indicated antisera. (E) Western blot analysis of Lonp-1 upon addition of Hsp70 inhibitor JG-98 and proteasomal inhibitor Bortezomib. HEK293 cells were grown to mid-confluence and were treated with the indicated reagents/times. Lysates were analyzed by SDS-PAGE/western blot using indicated antisera. (F) Growth assay of Pim1 phospho-site mutants in yeast. Indicated cells were grown under indicated conditions in 96-well format in a Synergy H1 plate reader. OD600 readings were taken at regular intervals for 35 min. Data shown are the average and standard deviation of at least 5 biological replicates. (G) Fluorescence images of cells expressing FlucSM–RFP and Tom70-GFP. Scale bars are 10 μm. (H) Western blot analysis of Pim1 wild type and phospho-mutants upon addition of Bortezomib. *Indicates Pim1 self-cleavage product. (I) IP analysis of Pim1 wild type and phospho-mutants with chaperone complex. Indicated cells were grown and processed as in (A). (J) Western blot analysis of Pim1 (wild type and phospho-mutants) expressed in the presence or absence of Ssa1 in E. coli. BL21 cells were co-transformed with indicated plasmids and were grown to early mid-log phase whereupon protein expression was induced with IPTG. After 4 h, total cell protein was isolated via sonication and lysates were analyzed by western blotting with indicated antisera. *Denotes Pim1 self-cleavage product. (K) Schematic of Ssa1 regulation of Pim1. Phosphorylated Pim1 interacts with Ssa1 preventing inappropriate activation of Pim1 in the cytoplasm. Pim1 dephosphorylation and Ssa1 dissociation permit Pim1 self-cleavage, critical for Pim1 activity in the mitochondria. Created with BioRender.com. The data underlying the graphs shown in the figure can be found in S1 Data. CTD, C-terminal domain; NBD, nucleotide-binding domain; SBD, substrate-binding domain.

