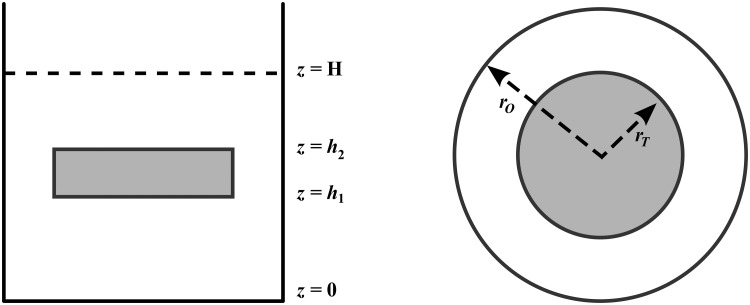
Fig 1. Schematic of the PCLS system.
The setup can be visualised side-on (left) or top-down (right). H represents the depth of the media, while h1 and h2 represent the bottom and top of the slice respectively. The radius of the well and the radius of the tissue slice are denoted rO and rT respectively. The total volume of media per well is 1.3ml.

