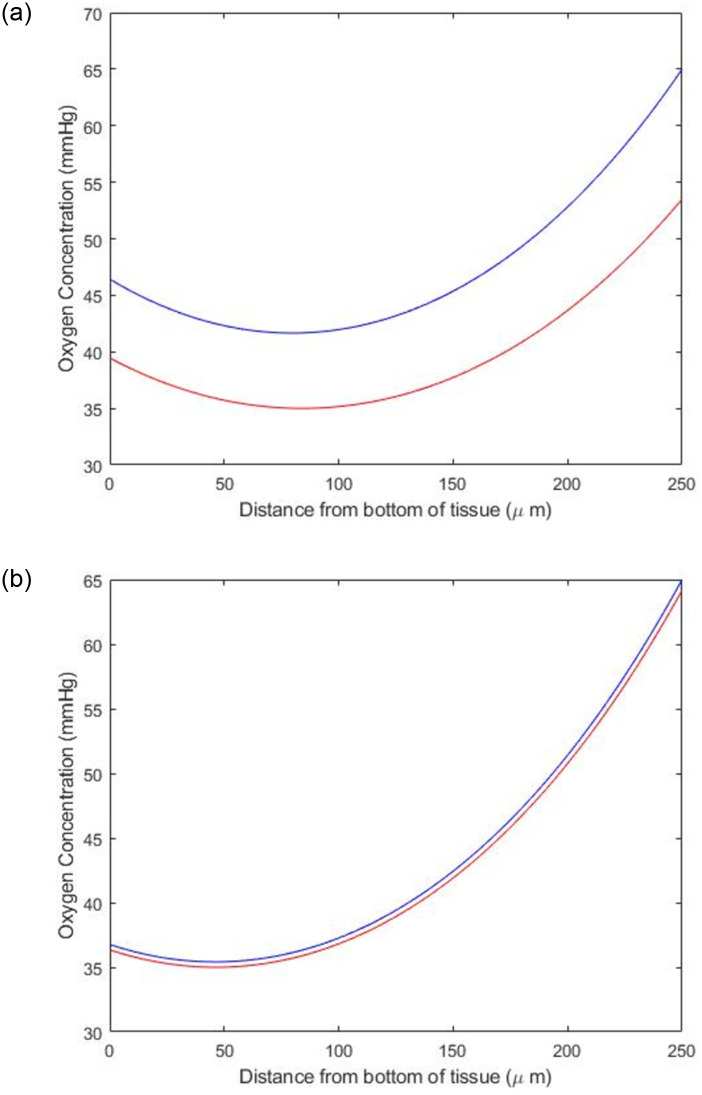
Fig 5. The variation of oxygen concentration through the thickness of a) a 5mm and b) an 8mm PCLS at 21% oxygen concentration.
The blue line corresponds to the depth within the well that gives a maximum concentration of 65mmHg, and the red line corresponds to the depth within the well (in a 12-well plate) that gives a minimum concentration of 35mmHg.

