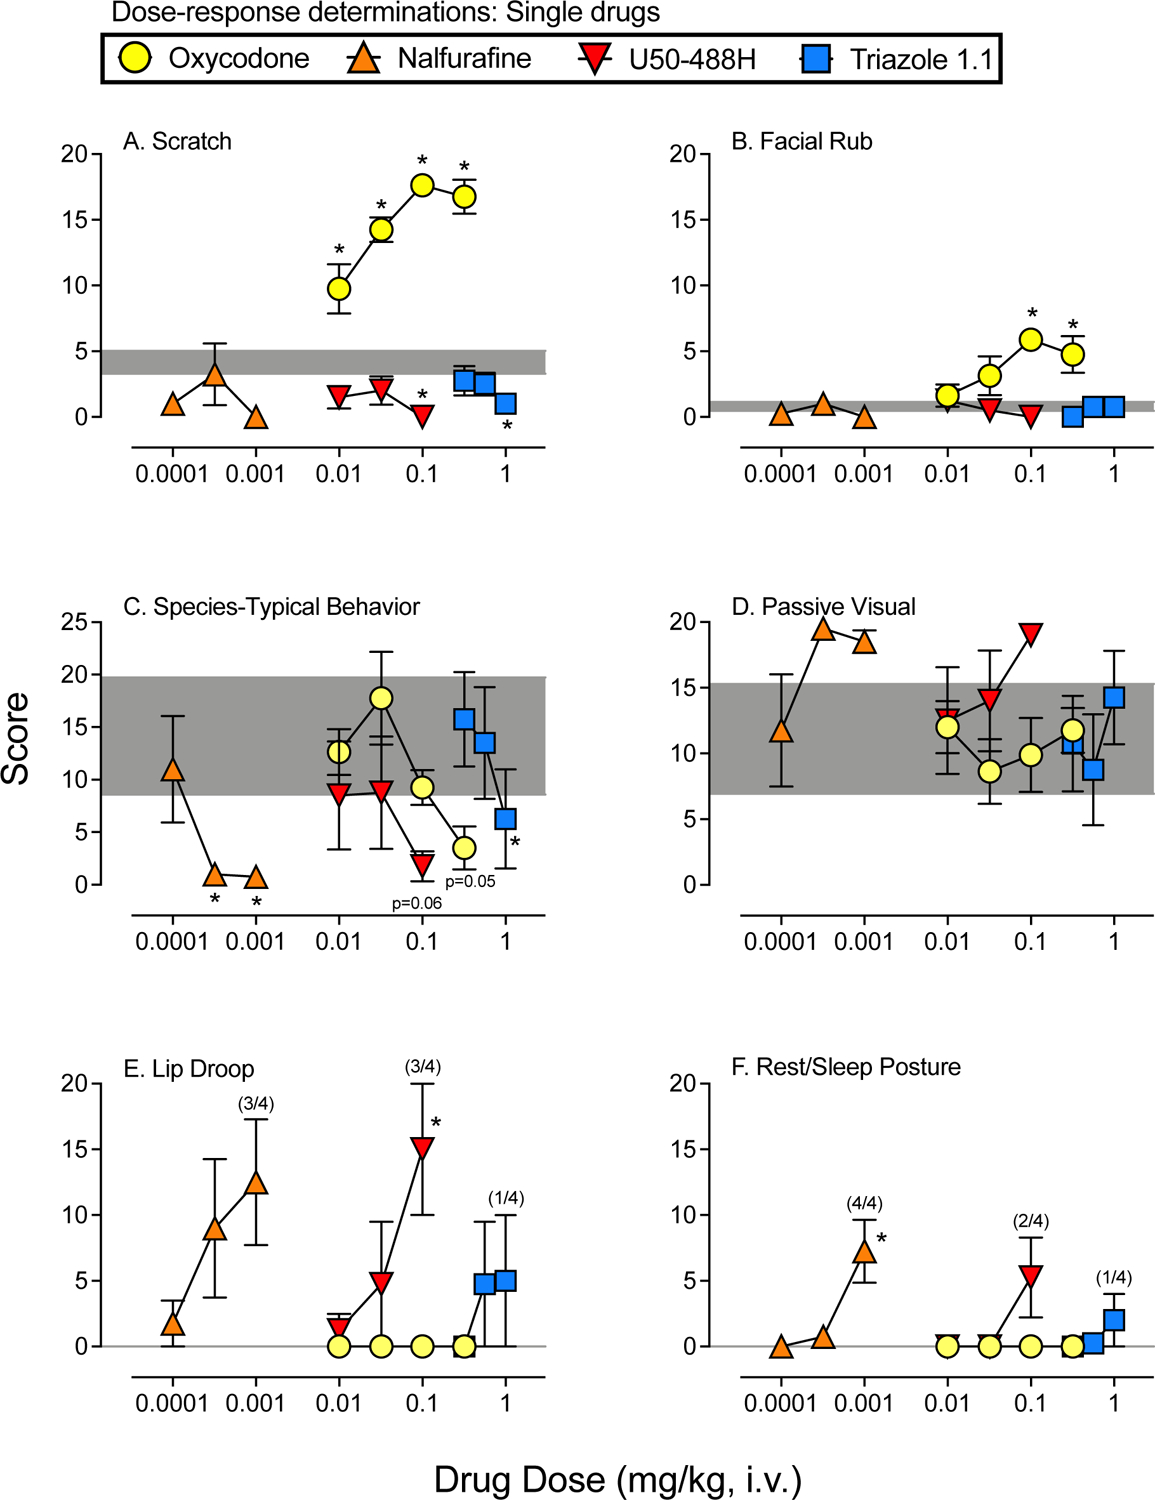
Figure 1. Dose-Response Determinations for Oxycodone and each KOR Agonist.

Mean (+SEM) score following administration of oxycodone (circles), nalfurafine (upward triangles), U50–488H (downward triangles), and triazole 1.1 (squares). All sessions lasted 5 min and began 10 min following vehicle or drug administration. Scores are shown in separate panels for scratch (A), facial rub (B), species-typical behavior (C), passive visual (D), lip droop (E), and rest/sleep posture (F). The shaded area represents the mean (+/−SEM) following vehicle administration. Asterisks represent doses of each drug that were statistically different from vehicle (p’s<0.05). Note: oxycodone alone and vehicle represent the same data in Figures 1–3.
