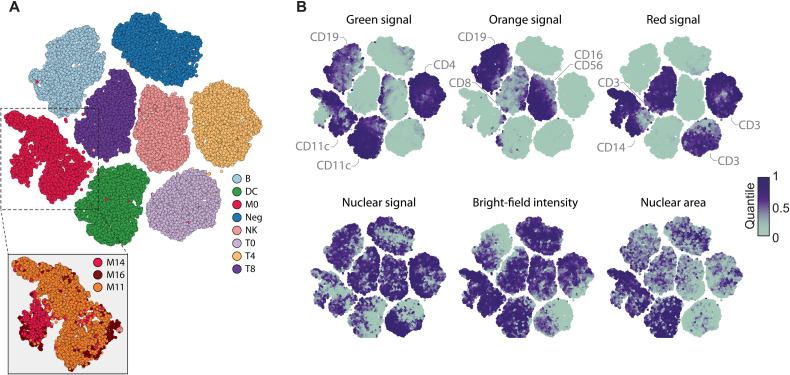
Fig. 2. Phenotypic landscape of the unperturbed immune system across 10 healthy donors.
(A) t-SNE of the eight-class CNN probabilities of up to 1000 randomly subsampled high-confidence multiplexed cells per class and per donor (class probability > 0.7). Monocytes are further divided into three subpopulations by thresholding the immunofluorescence (IF) intensity of CD16 and CD11c stainings, respectively (inset). Figure depicts a total of 78,850 cells, randomly sampled from 40 wells for each of the 10 donors. All donors were processed and measured together in a single experiment, across 40 replicate wells per donor distributed over two 384-well plates. (B) Selected single-cell features projected onto the t-SNE shown in (A). Median value of overlapping data points is calculated, and color is assigned accordingly. Points are plotted in order of intensity, with the lowest intensity on top.

