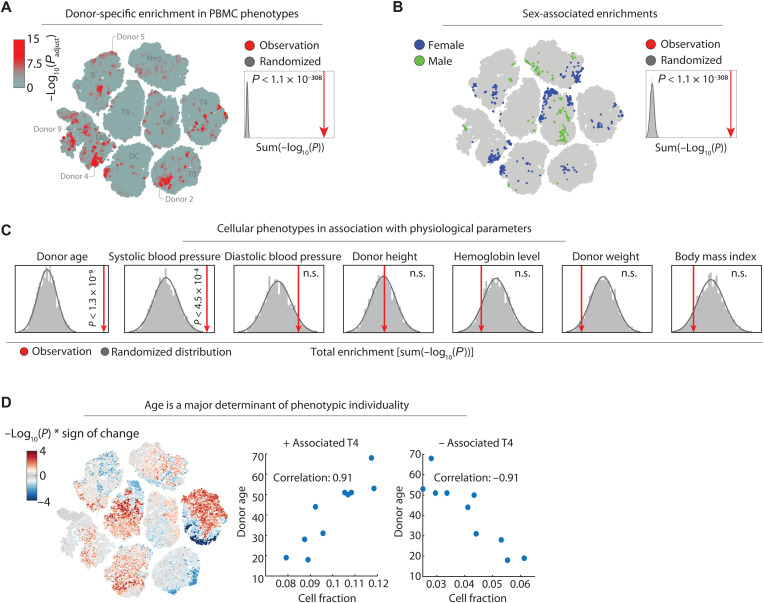
Fig. 4. LEA associates immune cell phenotypes with personal health information.
(A) LEA of donor-specific cells across 10 donors, visualized on the t-SNE of Fig. 2A. The cells are colored by their maximum LEA significance across the 10 donors [−log10(Padjust); see color bar). Inset: A randomized null distribution of donor enrichments was generated by randomizing the donor labels 2000 times and summing up all single-cell enrichments calculated by LEA per randomized run (gray bars). Sum enrichment of the actual data is shown in red, and the significance compared to the randomized runs is calculated by a one-sided t test. (B) LEA of biological gender-specific phenotypes projected onto the t-SNE. Cells are colored by their significant enrichment in female (blue) or male (green) specific phenotypes. Inset: A null distribution of random gender enrichment (gray) was generated by randomizing the donor labels 2000 times and summing up all single-cell enrichments calculated by LEA. Sum enrichment of the actual data is shown in red, as in Fig. 3A. (C) Association analysis of various health parameters with cellular phenotypes calculated by LEA. Null distributions of random correlation significance (gray) were generated by randomizing the donor labels 2000 times and summing up the all single-cell enrichments calculated by LEA per randomized run. Enrichment of the actual data is shown in red (one-sided t test). n.s., not significant. (D) LEA age associations projected onto the t-SNE. Single cells are colored by their signed significance of correlation [−log10(P) * sign of the correlation; see color bar]. Inset: Fraction of all significantly positive and negative age-associated CD4+ T cells with donor age (P < 0.05).

