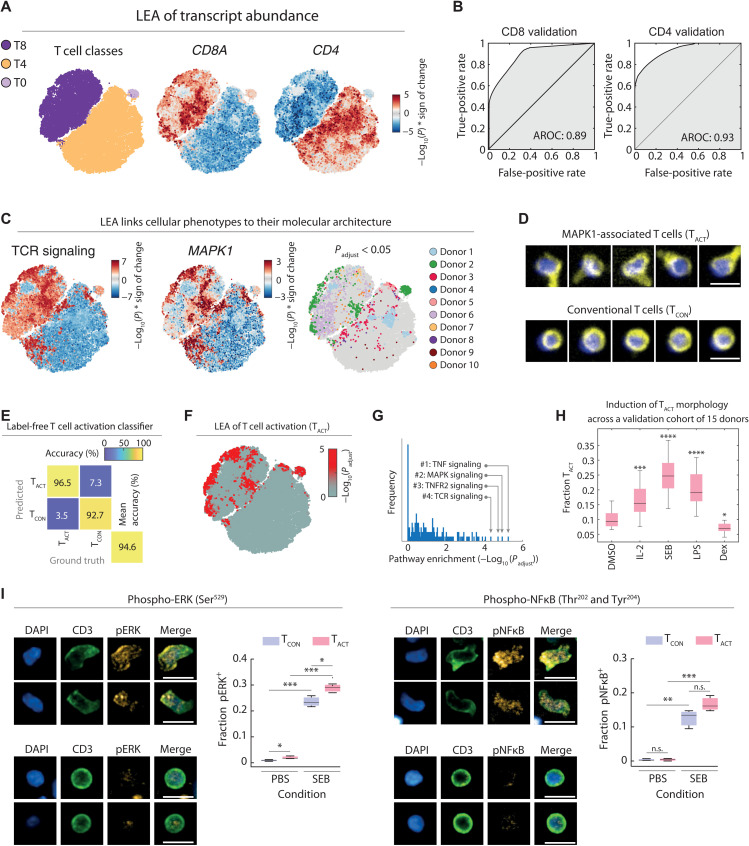
Fig. 5. Discovery and validation of an activated T cell morphology.
(A) t-SNE of the CNN class probabilities of T cells from 10 healthy donors. A total of 10,000 T cells were randomly selected across all T cell populations per donor (without confidence threshold) to reflect their original abundance in the respective sample. t-SNE colored per T cell class (left), by LEA-based associations with CD8A transcript abundance (middle), or CD4 transcript abundance (right) [−log10(P) * correlation sign]. (B) Area under the receiver operating characteristic curve (AROC) for the consistency between the CD8A LEA associations with CD8 levels by immunofluorescence (left) and the CD4 LEA associations with CD4 levels by immunofluorescence (right). (C) LEA associations of TCR signaling (left), MAPK1 transcript abundance (middle), and donor enriched regions (right; Padjust < 0.05 colored per donor) projected on the t-SNE map. (D) Representative CD8+ T cells from the positively MAPK1-associated regions (TACT) and conventional CD8+ T cells of other regions (TCON). Yellow, CD3; blue, DAPI. (E) Confusion matrix of the TACT classifier. Test set comprises 369 random TACT cells and 738 random TCON cells across multiple donors (including the 10 depicted donors). (F) LEA of the TACT phenotype projected on the t-SNE map. (G) Distribution of pathway significance across all retroactively classified TACT morphologies. Pathway enrichments were calculated using a hypergeometric test on positively associated genes (0.95 percentile), and P values were corrected for multiple testing. (H) Induction and suppression of the TACT phenotype with immunomodulatory agents across an independent validation cohort of 15 individual donors. Compounds were screened at 100 ng/ml. Box plots show the mean relative fraction of TACT of all T cells across all wells of each condition per donor. (I) Immunofluorescence quantification of phospho–nuclear factor κB (pNFκB) and phospho–extracellular signal–regulated kinase (pERK) levels in TACT and TCON cells. Box plots show the fraction of phospho-signaling positive TACT (red) and TCON (blue) cells after 48 hours of incubation with SEB or control (n = 3). Representative TACT and TCON cell morphologies shown. Scale bars, 10 μm. *P < 0.05, **P < 0.01, ***P < 0.001, ****P < 0.0001.

