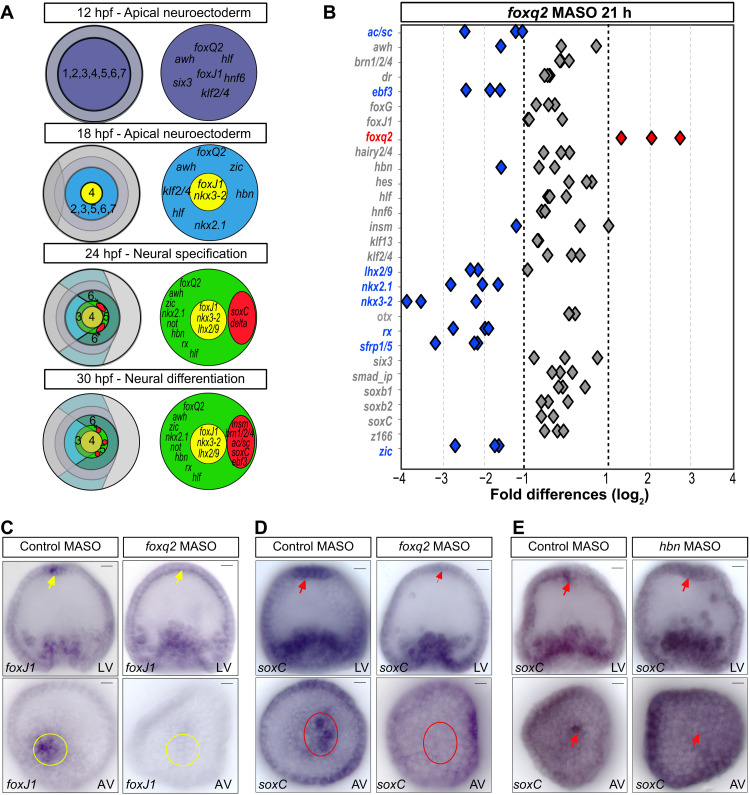
Fig. 2. Specification of neural progenitors downstream of FoxQ2 and Hbn.
(A) Summary of developmental expression of regulatory genes in apical cell fate domains, suggesting a regulatory hierarchy of neuronal specification. (B) NanoString analysis of regulatory gene expression in embryos injected with foxq2 morpholinos or control morpholinos, shown as fold differences in expression levels at 21 hpf. Gene expression of apical genes is indicated as unaffected (gray), up-regulated (red), or down-regulated (blue) by injection of foxq2 morpholinos compared to control. (C and D) Spatial expression of foxJ1 (C) and soxC (D) in embryos injected with control morpholinos and foxQ2 morpholinos and analyzed by WMISH at 30 hpf. (E) Spatial expression of soxc in embryos injected with control morpholinos and hbn morpholinos and analyzed by WMISH at 30 hpf. MASO, morpholino antisense oligonucleotides. Scale bars, 20 μm.

