
Fig. 1. d-2HG impairs CD8+ T cell proliferation, cytotoxicity, and IFN-γ signaling in an acute and reversible fashion.
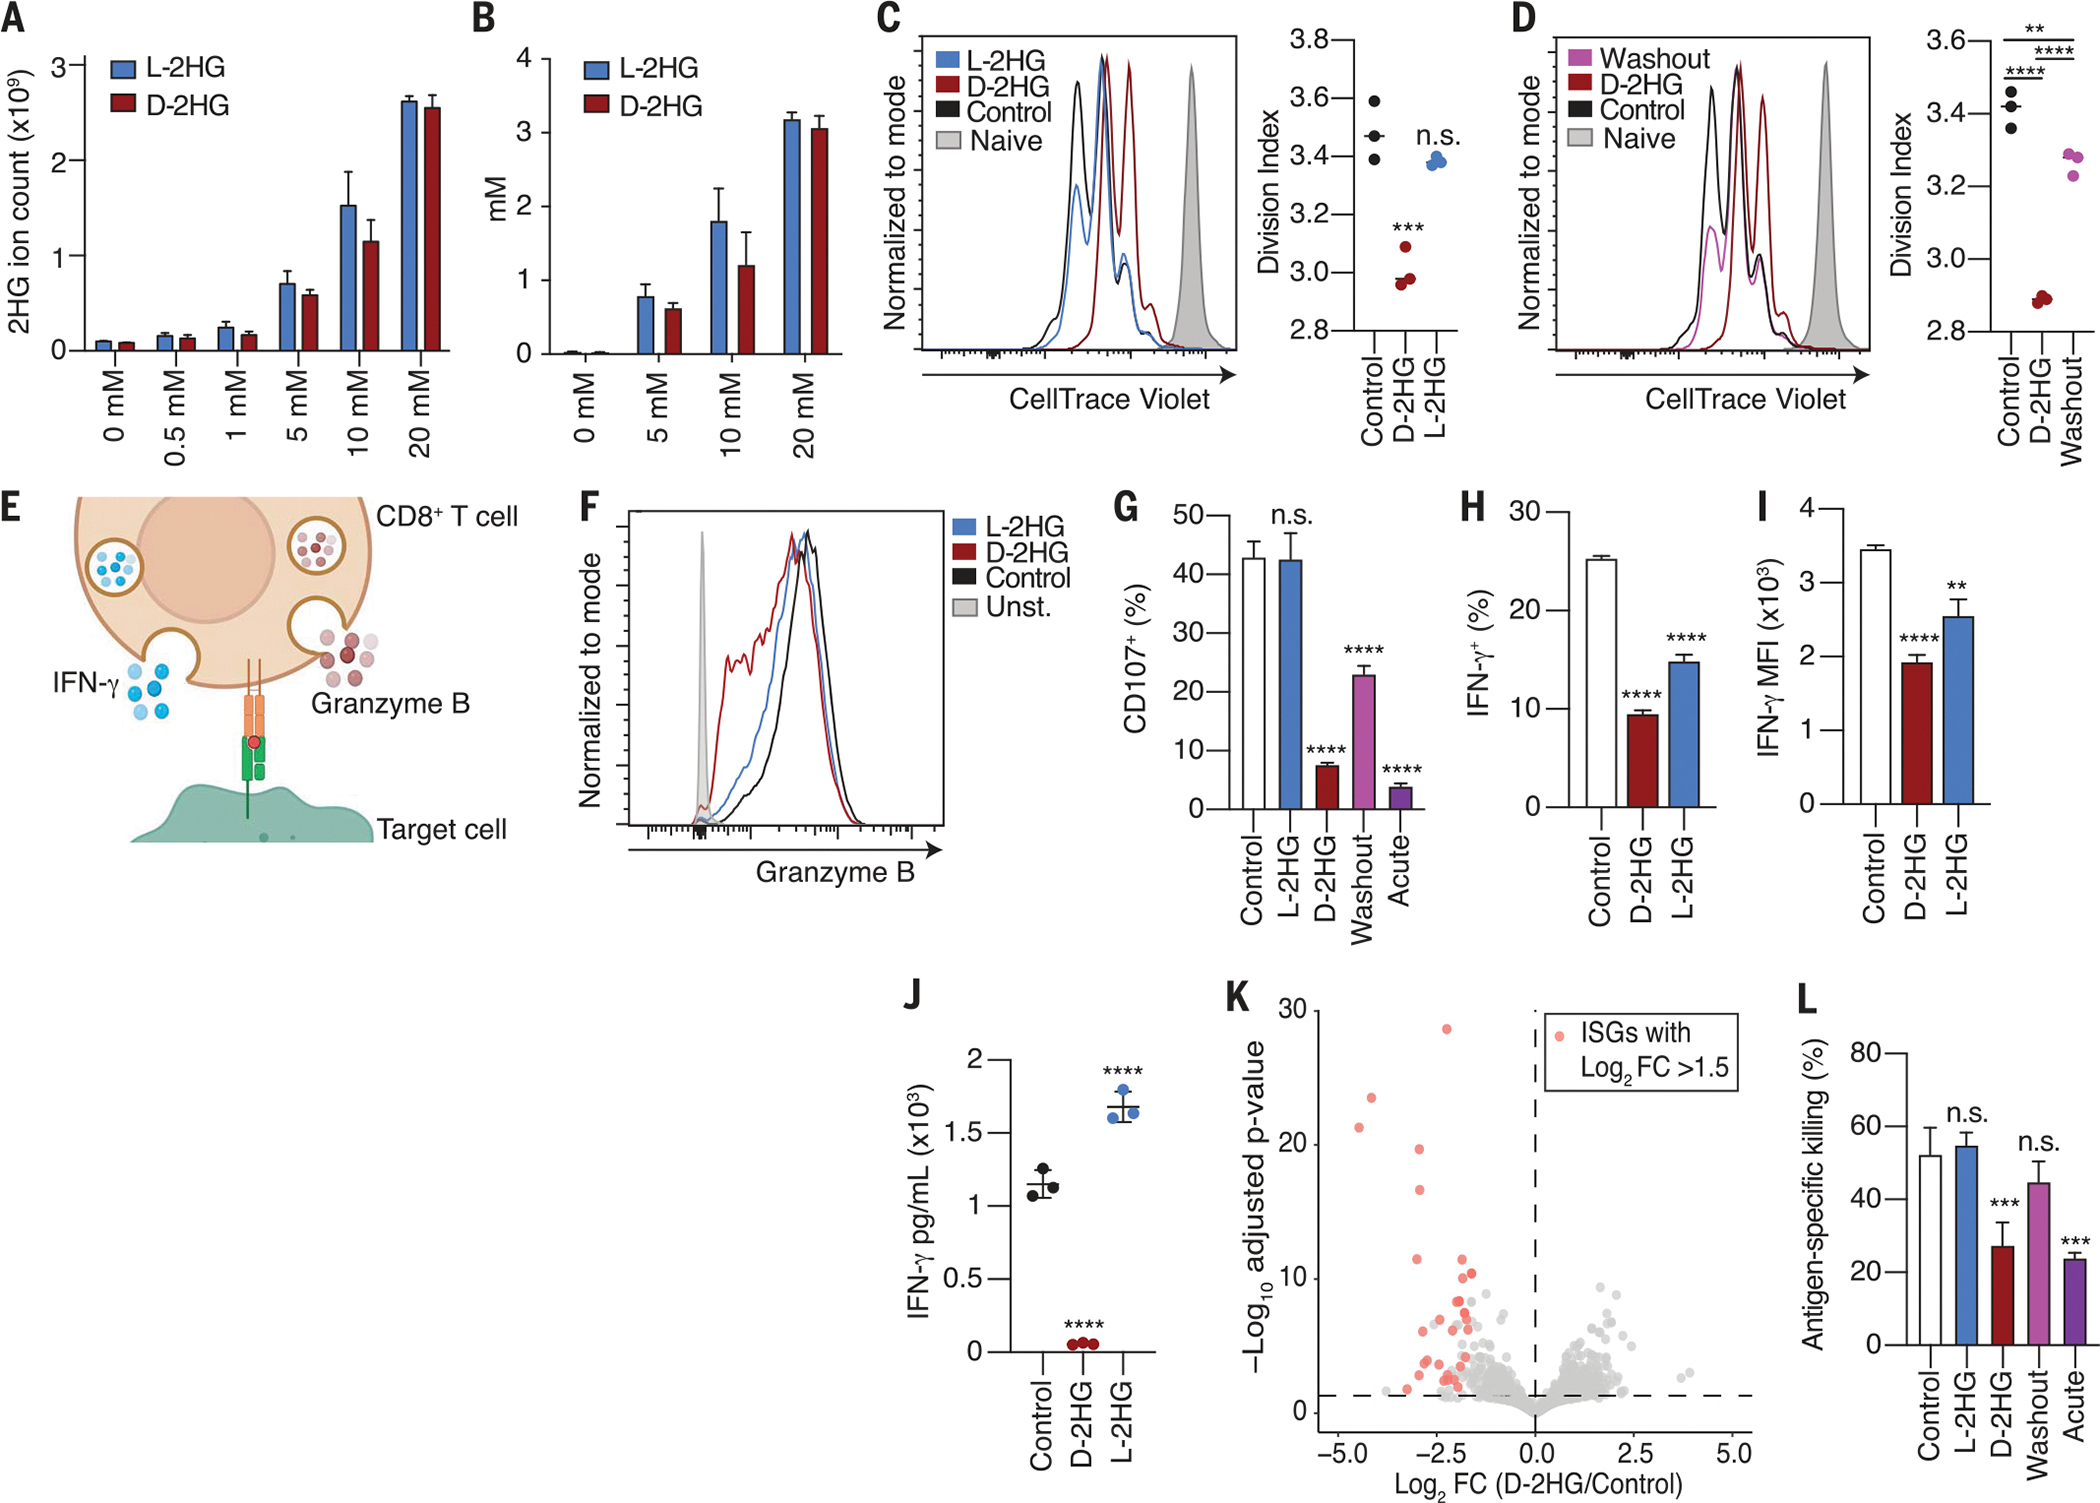
(A) Total 2HG levels in activated CD8+ T cells after 24-hour treatment with increasing concentrations of d-2HG or l-2HG. Total ion count was normalized to cell number (n = 3). (B) Intracellular 2HG concentration determined by assuming a T cell volume of 500 fl (n = 3). (C) Left: CellTrace Violet dilution assay at day 3 of CD8+ T cells activated by CD3/CD28 mAbs in the presence of 20 mM d-2HG, 20 mM l-2HG, or left untreated. Stained, naive cells (shaded gray) that did not proliferate are shown. Right: Division index corresponds to the average number of cell divisions that a cell in the total cell population has undergone (n = 3). (D) CellTrace Violet dilution assay according to experimental design described in fig. S1E to assess reversibility of proliferation phenotype. (E) Schematic of a cytotoxic CD8+ T cell releasing granzyme B and IFN-γ. (F) Intracellular granzyme B levels of CD8+ T cells activated by CD3/CD28 mAbs in the presence of 20 mM d-2HG, 20 mM l-2HG, or left untreated for 3 days. (G) Percentage degranulation as assessed by CD107a/b staining of CD8+ T cells activated by CD3/CD28 mAbs and restimulated by CD3 mAb in the presence of 20 mM d-2HG, 20 mM l-2HG, or left untreated. In the washout condition, CD8+ T cells were activated in the presence of 20 mM d-2HG, and the oncometabolite was subsequently washed out before restimulation. In the acute condition, d-2HG was added solely at the time of restimulation. In all other conditions, the metabolites were kept for the entirety of the assay (n = 3). (H) Percentage of IFN-γ+ CD8+ T cells after intracellular cytokine staining of CD8+ T cells activated with phorbol myristate acetate (PMA) and ionomycin for 4 hours in the presence of 20 mM d-2HG, 20 mM l-2HG, or left untreated (n = 3). (I) Mean fluorescent intensity for IFN-γ after intracellular cytokine staining of CD8+ T cells activated with PMA and ionomycin for 4 hours in the presence of 20 mM d-2HG, 20 mM l-2HG, or left untreated (n = 3). (J) IFN-γ levels in the medium of CD8+ T cells activated with 20 mM d-2HG, 20 mM l-2HG, or left untreated for 24 hours (n = 3). (K) Volcano plot showing distribution of the top down-regulated and up-regulated genes in CD8+ T cells activated in the presence of 20 mM d-2HG or left untreated. Statistically significant ISGs with a fold change >1.5 are marked in pink (n = 3). (L) Antigen-specific killing of B16 ovalbumin-positive tumor cells by OT1 CD8+ T cells that were activated in the presence of 20 mM d-2HG, 20 mM l-2HG, or left untreated. In the washout condition, d-2HG was removed before co-culture seeding of tumor cells and T cells. In the acute condition, d-2HG was added at the time of tumor cell and T cell co-culture. In all other conditions, the metabolites were kept for the entirety of the assay (n = 3). *P < 0.05, **P < 0.01, ***P < 0.001, ****P < 0.0001 (one-way and two-way ANOVA). Data are representative of at least two independent experiments.