
Fig. 2. d-2HG alters glycolysis in CD8+ T cells.
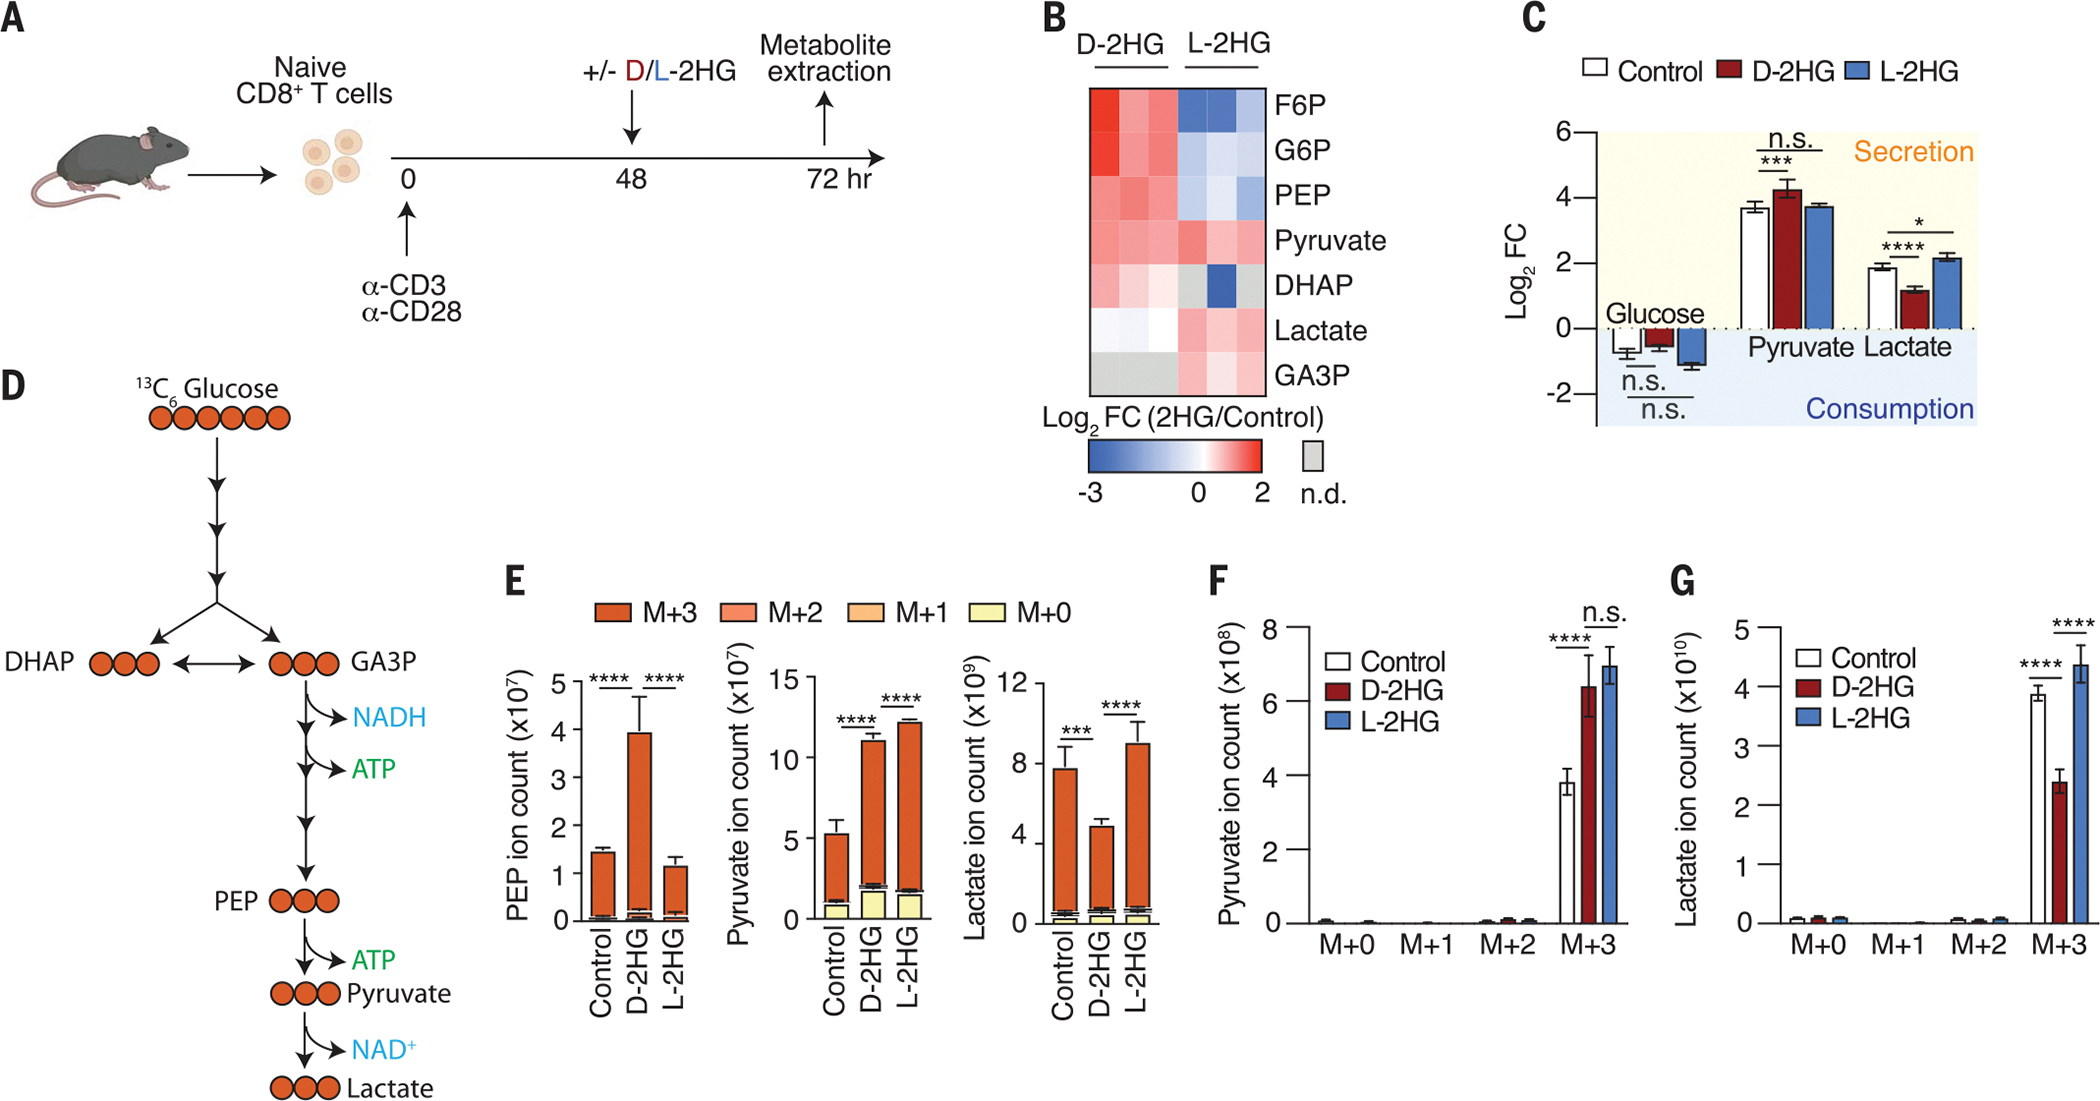
(A) Schematic of experimental design to assess the acute (24 hours) effects of 20 mM d-2HG and 20 mM l-2HG on steady-state metabolite levels in activated CD8+ T cells. (B) Log2 fold changes of glycolytic intermediates in 20 mM d-2HG–treated versus 20 mM l-2HG–treated CD8+ T cells relative to control. F6P, fructose 6-phosphate; G6P, glucose 6-phosphate; DHAP, dihydroxyacetone phosphate; GA3P, glyceraldehyde 3-phosphate; PEP, phosphoenolpyruvic acid (n = 3). (C) Log2 fold changes of key glycolytic metabolites that are secreted into or consumed from the medium of d-2HG–treated, l-2HG–treated, or untreated CD8+ T cells (n = 3). (D) Schematic of expected incorporation of heavy carbons into glycolytic intermediates after 13C6 glucose is provided for 24 hours. (E) Ion intensities of glycolytic intermediates and their respective 13C-isotopologs after 24-hour cotreatment of 13C6 glucose with 20 mM d-2HG, 20 mM l-2HG, or control (n = 3). (F) Levels of secreted pyruvate isotopologs in the medium of 20 mM d-2HG–treated, 20 mM l-2HG–treated, and untreated CD8+ T cells after providing 13C6 glucose for 24 hours (n = 3). (G) Levels of secreted lactate isotopologs in the medium of 20 mM d-2HG–treated, 20 mM l-2HG–treated, and untreated CD8+ T cells after providing 3C6 glucose for 24 hours (n = 3). *P < 0.05, **P < 0.01, ***P < 0.001, ****P < 0.0001 (two-way ANOVA). Data are representative of at least two independent experiments.