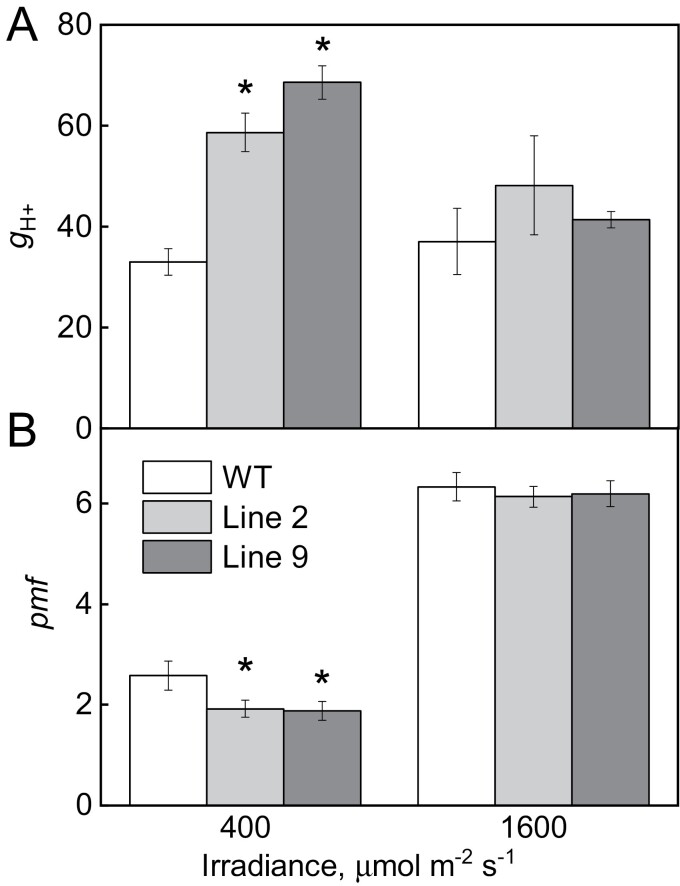
Fig. 3.
Proton conductivity of the thylakoid membrane (gH+) and proton motive force (pmf) estimated from the dark interval relaxation kinetics of ECS in WT O. sativa and transgenic lines overexpressing AtpD. Mean ±SE, n=3-4 biological replicates. Asterisks indicate statistically significant differences between transgenic lines and the WT (t-test, P<0.05).

