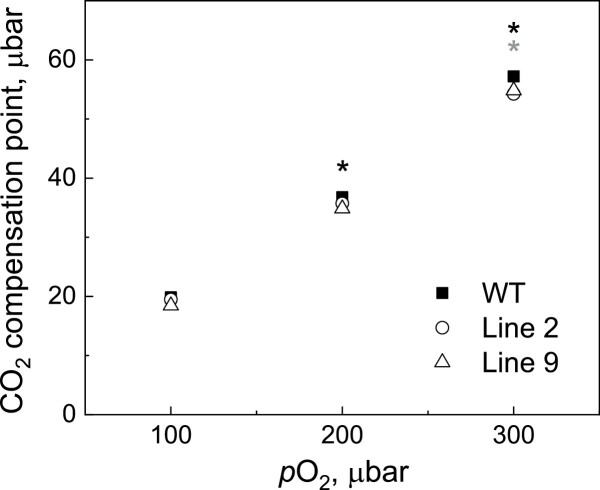
Fig. 7.
Leaf CO2 compensation point measured at different O2 partial pressures (pO2). Mean ±SE, n=3 biological replicates; SE is smaller than the symbols. Grey asterisks indicate statistically significant differences between line 2 and the WT, black asterisks—between line 9 and the WT (t-test, P<0.05).

