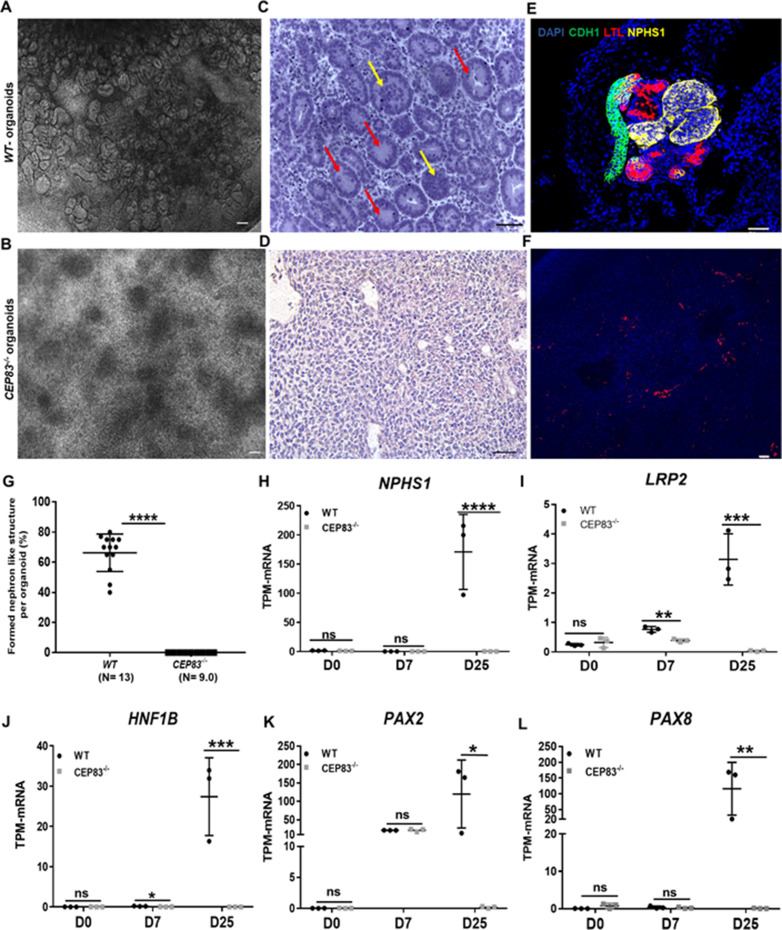
Figure 3. Defective kidney organoid differentiation from CEP83-deficient pluripotent stem cells.
(A, B) Brightfield images of organoids after a total of 25 days of culture (D25) indicate the formation of multiple kidney-like structures in WT organoids (A), whereas CEP83−/− organoids are composed of uniform clusters (B). (C, D) Representative images of hematoxylin-eosin–stained sections of organoids. WT organoids (C) display glomerulus-like (yellow arrows) and tubular (red arrow) components, whereas CEP83−/− organoids (D) are composed of monomorphic mesenchymal-like cells. (E–F) Whole mounting immunostaining of organoids for NPHS1 (podocyte marker), LTL (proximal tubule marker), and CDH1 (distal tubule marker) indicates segmented nephron-like structures in WT organoids (E), and the absence of such structures in CEP83−/− organoids (F). (G) Quantitative analysis of brightfield images indicating the estimated percentage of organoid area composed of nephron-like structures, organoids were collected from three different experiments. (H–L) Gene expression (transcripts per million [TPM]) of NPHP1 (H), LRP2 (I), HNF1B (J), PAX2 (K), and PAX8 (L) in WT and CEP83−/− cells at the indicated time points based on bulk RNA sequencing. n=3 clones per group. Data are mean ± SD. *p<0.05, **p<0.01, ***p<0.001, and ****p<0.0001. ns = not significant. Panels A–F: Bar = 50 μm. See Figure 3—source data 1 and 2. See also Figure 3—figure supplements 1–2.
Figure 3—figure supplement 1. Whole mount immunostaining of the wildtype organoids shows positive staining for NPHS1 (podocyte marker), LTL (proximal tubule marker), and CDH1 (distal tubule marker).
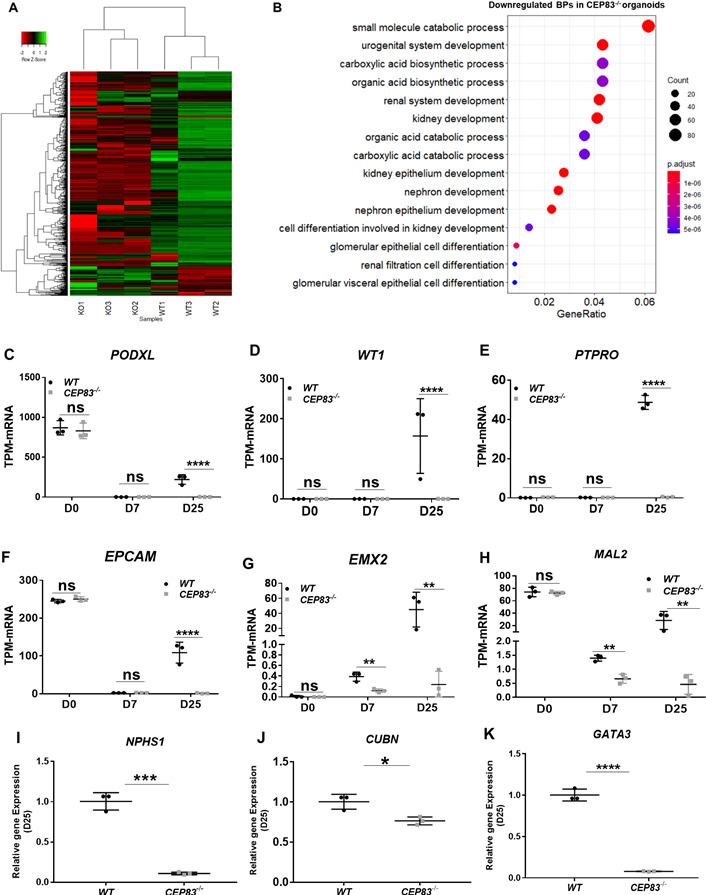
Figure 3—figure supplement 2. mRNA analysis of organoids differentiated for 7+ (18) days indicates marked differences in global gene expression in CEP83−/− (KO1–KO3) compared to wildtype (WT1–WT3) organoids.


