. 2022 Oct 12;11:e80165. doi: 10.7554/eLife.80165

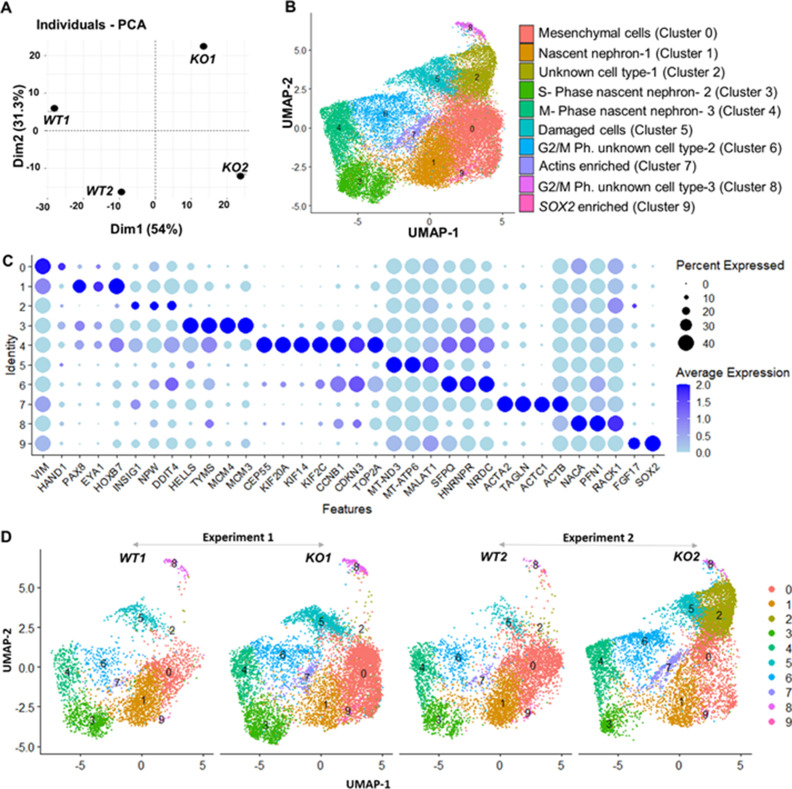
Figure 4. Gene expression differences of wildtype (WT) and CEP83−/− D7 monolayers based on bulk and single-cell transcriptomics.

(A) Principal component analysis (PCA) of WT (WT1, WT2) and CEP83−/− (KO1, KO2) cells at day 7 using the average gene expression of the top highly variable 1000 genes in pseudo-bulk scRNA sequencing data. The % variation explained by each PCA axis is indicated in brackets. (B) PCA eigenvalues indicate that the principal components, Dim 1 (54%) and Dim 2 (31.3%), account for 85.3% of the expression differences. Dim 1 separates the WT samples from the KO samples, while Dim 2 separates experiment 1 (WT1, KO1) from experiment 2 (WT2, KO2). (B) Uniform manifold approximation and projection (UMAP) of scRNA-seq profiles from 27,328 cells from two wildtype clones (WT1, WT2) and two CEP83−/− clones (KO1, KO2) derived from two separate experiments (experiment 1: WT1, KO1; experiment 2: WT2, KO2). Unbiased clustering resulted in 10 clusters, and (C) dot plots show expression of selected marker genes of each cluster. (D) UMAP plots for WT and KO samples show the distribution of all clusters per sample (N=2 per group) in B–D. See Figure 4—figure supplements 13. Source data is available as described in section (Data availability).

Figure 4.

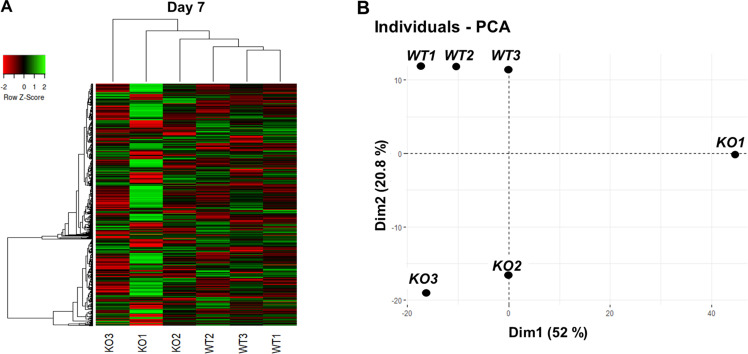
Figure 4—figure supplement 1. Bulk RNA sequencing shows mild overall gene expression differences between WT and CEP83-deficient cells at day 7 of differentiation.

Figure 4—figure supplement 1.

(A) Heat map of bulk RNA-seq data showing the most highly variable 1000 genes (see Methods, maximum transcripts per million ≥10) within wildtype (WT1, WT2, and WT3) and CEP83−/− (KO1, KO2, and KO3) clones at day 7 of differentiation. Unbiased hierarchical clustering of clones separates CEP83−/− and WT transcriptomes. (B) Principal component analysis (PCA) of WT (WT1, WT2, WT3) and CEP83−/− (KO1, KO2, KO3) cells at day 7 using the average gene expression of the top highly variable 1000 genes in bulk RNA sequencing data. The % variation explained by each PCA axis is indicated in brackets. PCA eigenvalues indicate that the principal components, Dim 1 (52%) and Dim 2 (20.8%), account for 85.3% of the expression differences. Dim 1 separates the KO1 sample from the other samples, while Dim 2 separates experiment 1 (WT1, WT2, WT3) and (KO1, KO2, KO3).
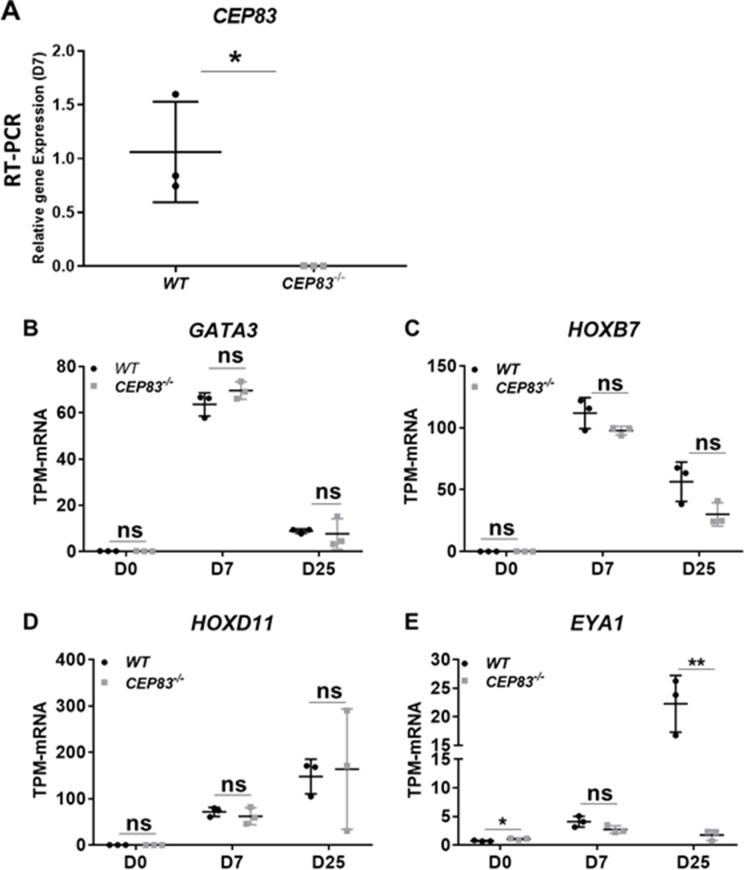
Figure 4—figure supplement 2. Expression of intermediate mesoderm marker genes in WT and CEP83−/− human-induced pluripotent stem cells (hiPSCs) after 7 days of differentiation in a monolayer culture.

Figure 4—figure supplement 2.

(A) mRNA expression of CEP83 was significantly downregulated in the CEP83−/− clones on day 7. The expression was investigated in bulk RNA seq data and confirmed by RT-PCR. (B–C) Using bulk RNA sequencing data, the expression of ureteric bud marker genes including GATA3 and HOXB7 shows no significant change between WT and mutated cells at days 0, 7, and 25. While, (C–D) MM marker genes including HOXD11 and EYA1 show no significant difference between WT and CEP83−/− cells on days 0, 7, and 25 except EYA1 show significant downregulation in the mutated cells on day 25. n=3 clones per group. Data are mean ± SD. *p<0.05 and **p<0.01. ns = not significant.
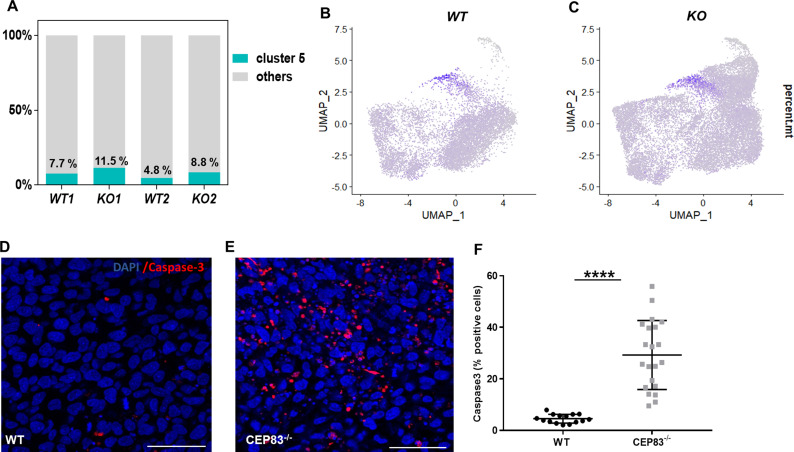
Figure 4—figure supplement 3. CEP83 loss induces apoptosis at day 7 of differentiation.

Figure 4—figure supplement 3.

(A) Single-cell RNA sequencing data shows that the cell proportion of damaged cells (cluster 5) in the wildtype samples (WT1, WT2) is numerically lower than that in CEP83−/− cells (KO1, KO2). (B, C) Feature plots of the percentage of mitochondrial RNAs (percent.mt) in WT and CEP83−/− cells demonstrating an upregulation in cluster 5. (D, E, F) Staining of day 7 cells for active caspase 3 indicates significantly more apoptotic cells in CEP83−/− compared to WT cells. n=2 clones per group in A–E, and n=3 clones per group in F–H. ****p<0.0001. Panel D–E: Bar = 50 μm.