. 2022 Oct 12;11:e80165. doi: 10.7554/eLife.80165

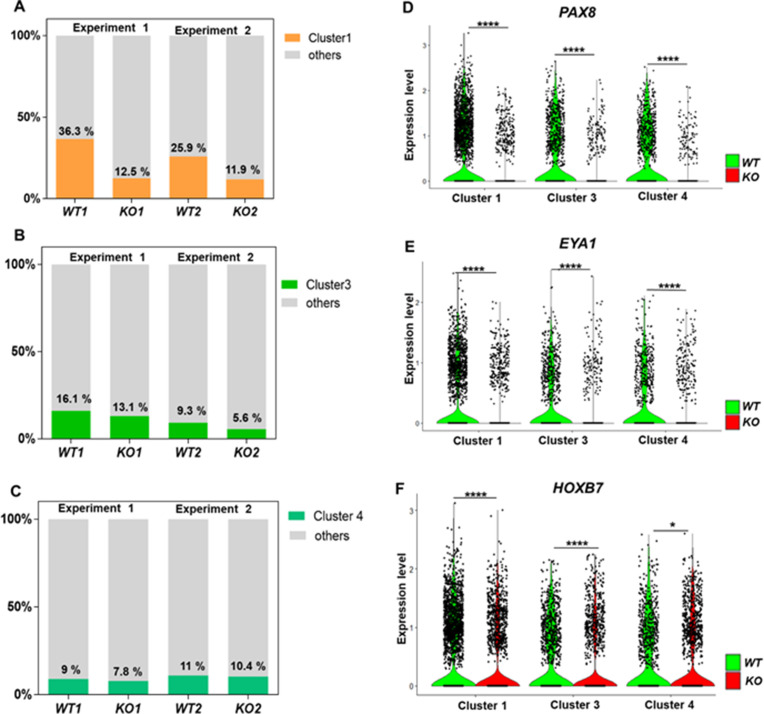
Figure 5. Defective kidney progenitor differentiation from CEP83−/− cells after 7 days of monolayer induction.

(A, B, C) Proportions of cells from kidney progenitor clusters 1 (A), 3 (B), and 4 (C) among wildtype (WT1, WT2) and CEP83−/− (KO1, KO2) cells. (D, E, F) Violin plots of gene expression of kidney progenitor genes PAX8 (D), EYA1 (E), and HOXB7 (F) within kidney progenitor clusters 1, 3, and 4 comparing wildtype (WT) and CEP83−/− (KO) cells. N=2 per group. *p<0.05 and ****p<0.0001. Figure 5—figure supplements 12. Source data is available as described in section (Data availability).

Figure 5.

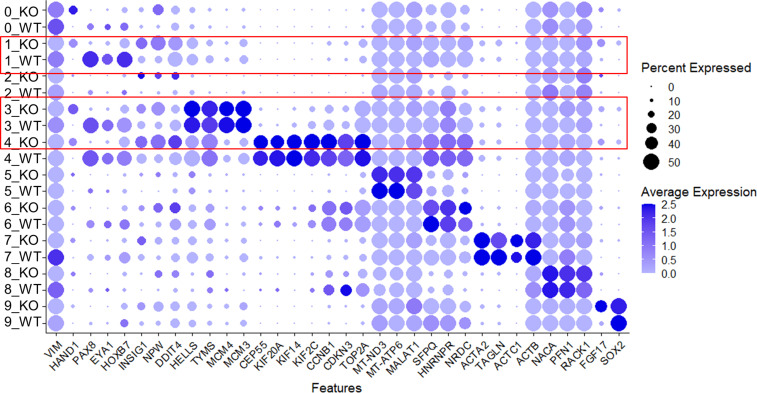
Figure 5—figure supplement 1. Expression of selected genes per cluster and per group (WT vs. CEP83−/−).

Figure 5—figure supplement 1.

Please note downregulated expression of nephron progenitor genes PAX8, EYA1, and HOXB7 in clusters 1, 3, and 4 (marked in red) in CEP83−/− cells.
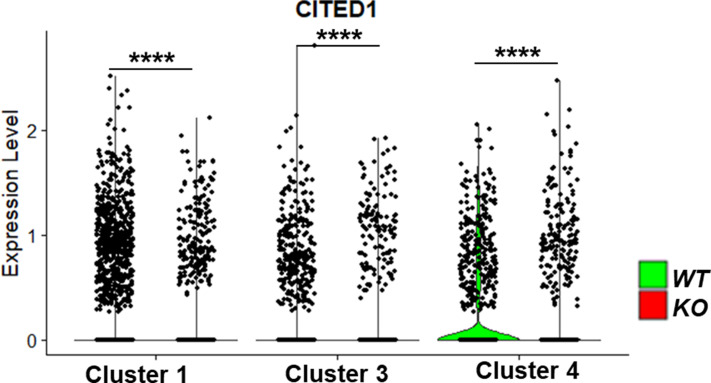
Figure 5—figure supplement 2. Violin plots of gene expression of kidney progenitor gene CITED1 within kidney progenitor clusters 1, 3, and 4 comparing wildtype (WT) and CEP83−/− (KO) cells.

Figure 5—figure supplement 2.

N=2 per group. ****p<0.0001.
Figure 5—figure supplement 3. Violin plots of single-cell RNA sequencing show downregulated expression of genes encoding ciliary proteins in CEP83−/− cells, including (A) the basal body protein oral-facial-digital type I OFD1, (B) pericentriolar material-1 (PCM1), and (C) RAS oncogene family 11 A (RAB11A).

Figure 5—figure supplement 3.

The three genes are essential for primary cilium formation, and their loss results in defective ciliogenesis (Mugford et al., 2008b; Mae et al., 2013; Mahlapuu et al., 2001). Data are derived from two biological replicates per group. ****p<0.0001.