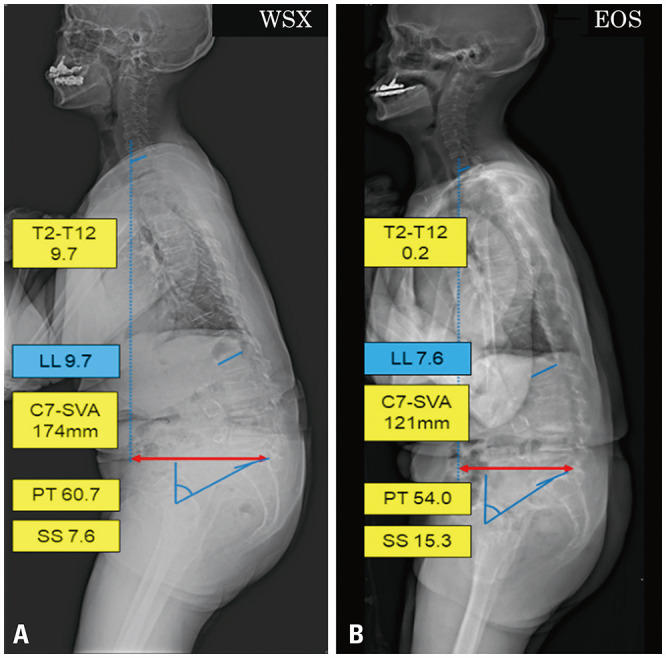
Fig. 3. Typical case of the sagittally imbalanced group. Compared to WSX (A), EOS (B) showed smaller PT (60.7° to 54.0°), C7-SVA (174 to 121 mm), T2-T12 (9.7° to 0.2°), and larger SS (7.6° to 15.3°), indicating a compensation. WSX, conventional whole spine X-ray; PT, pelvic tilt; SS, sacral slope; SVA, sagittal vertical axis.

