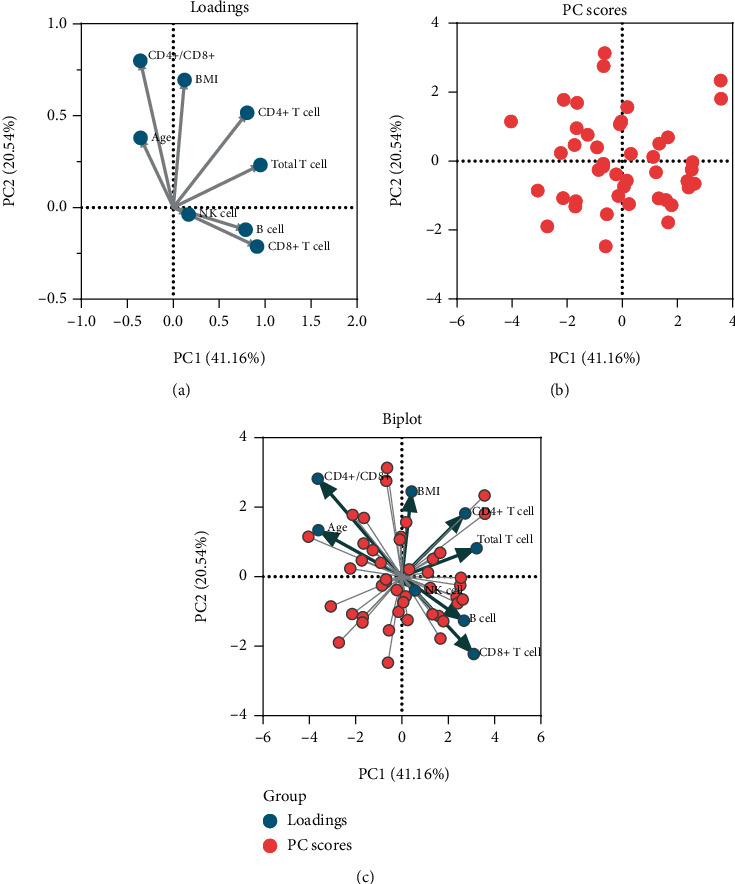
Figure 1.

Principal component analysis (PCA) for different measurements on the patients with senile OP. The loading plot depicted the correlation of eight measurements and showed that age was associated with PC2. The absolute counts of CD8+ T lymphocytes were correlated with PC1 (a). The PC score plot showed that the data from 44 patients with OP were significant (b). Finally, a biplot was used to show both the loadings and PC scores (c).
