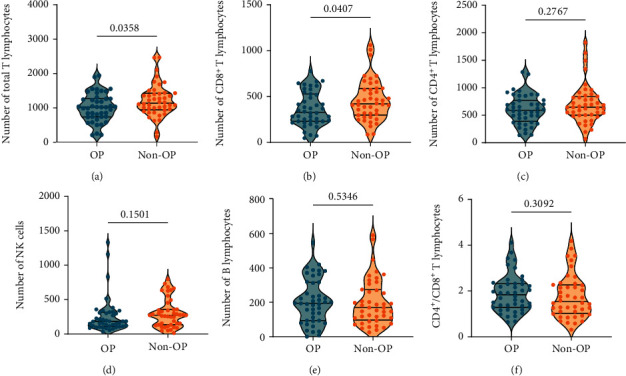
Figure 2.

Comparison of the absolute counts of lymphocyte subsets between the OP and non-OP groups. The absolute counts of total T lymphocytes (a), CD8+ T lymphocytes (b), CD4+ T lymphocytes (c), NK cells (d), B cells (e), and CD4+/CD8+ T lymphocytes ratio (f) between the OP and non-OP groups were analyzed. Continuous variables in the normal distribution of the two groups were expressed as mean ± standard deviation (mean ± SD) and analyzed with the unpaired t-test. Continuous variables in the abnormal distribution were expressed as quartiles (50% (25%-75%)) and analyzed by the Mann-Whitney U test. P value < 0.05 was considered a significant difference.
