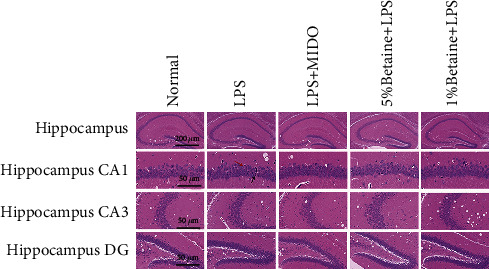
Figure 3.

HE staining to observe the morphological changes of LPS-induced mice hippocampal CA1, CA3, and DG regions, n = 6. Red arrows indicate the irregular arrangement of neurons with enlarged pericellular spaces, black arrows indicate the neuronal pyknosis and the deepened coloration.
