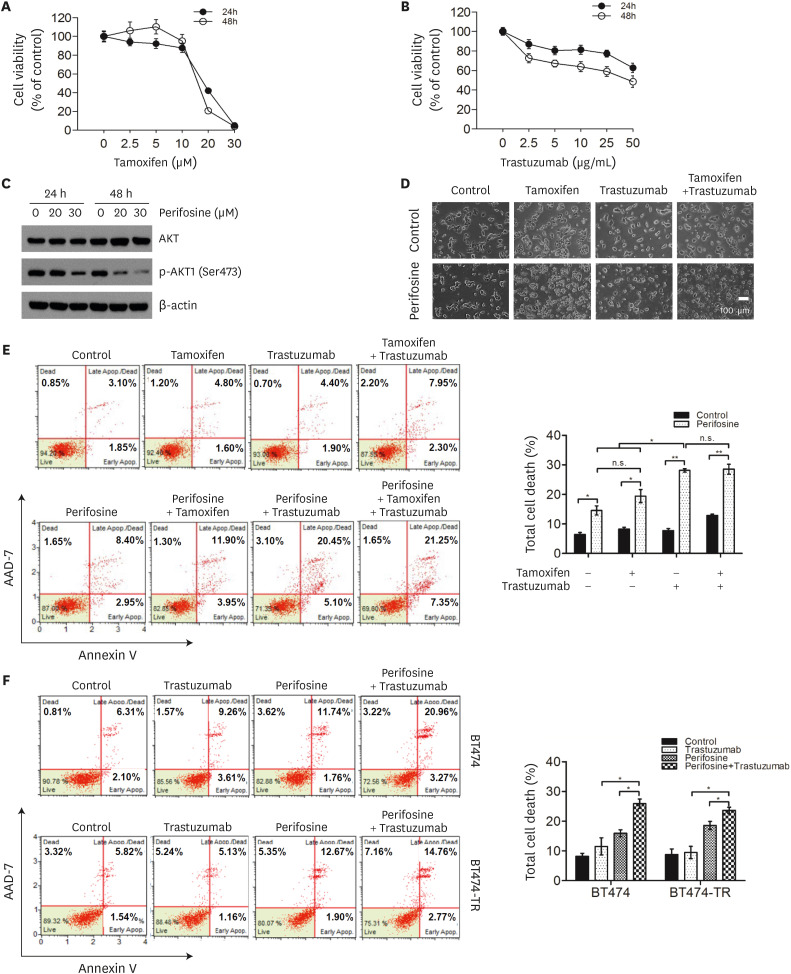
Figure 5. AKT inhibitor enhanced trastuzumab-induced cell death in BT474 and BT474-TR cells.
The effects of tamoxifen (A) and trastuzumab (B) on cell viability were analyzed using the MTT assay (n = 3). (C) Protein levels of AKT and p-AKT (Ser473) in the perifosine-treated BT474 cells. Cells were treated with 20 or 30 μM perifosine, an AKT inhibitor, for 24 or 48 hours and then subjected to western blot analysis. β-Actin was used as an internal control. (D) BT474 cells were treated with or without 20 μM perifosine and co-treated with 10 μM tamoxifen and/or 2 μg/mL trastuzumab for 48 hours. Cell morphology was examined using a microscope. (E, F) Flow cytometric analysis of apoptotic cells using the Muse™ Annexin V & Dead Cell Kit. Control- or perifosine-treated BT474 cells were cotreated with 10 μM tamoxifen and/or 2 μg/mL trastuzumab for 48 hours (E). Control- or perifosine-treated BT474 and BT474-TR cells were cotreated with 2 μg/mL trastuzumab for 48 hours (F). All data in the graphs are presented as the mean ± standard deviation (n = 3). Images represent three independent experiments.
MTT = 3-(4,5-dimethylthiazol-2-yl)-2,5-diphenyltetrazolium bromide; p-AKT1 = phosphorylated AKT1; n.s. = non-significant.
*p < 0.05; **p < 0.01.

