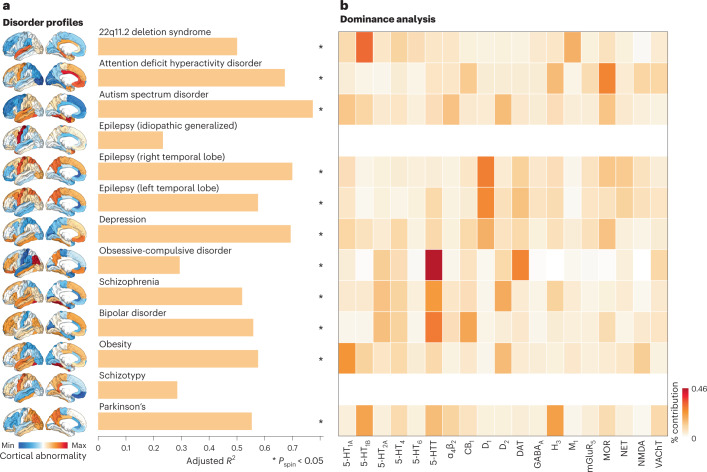
Fig. 6. Mapping receptors to disease vulnerability.
Using a multi-linear model, neurotransmitter receptor/transporter distributions were fit to patterns of cortical abnormality for 13 neurological, psychiatric and neurodevelopmental disorders, collected by the ENIGMA consortium. a, The significance of each model is assessed using a spatial autocorrelation-preserving null model and is corrected for multiple comparisons (FDR). Asterisks denote significant models (FDR-corrected Pspin < 0.05, one-sided). 22q11.2 deletion , Pspin = 0.02; ADHD , Pspin = 0.02; autism , Pspin = 0.02; epilepsy (IGE) , Pspin = 0.17; epilepsy (right) , Pspin = 0.02; epilepsy (left) , Pspin = 0.02; depression , Pspin = 0.01; OCD , Pspin = 0.02; schizophrenia , Pspin = 0.02; BD , Pspin = 0.01; obesity , Pspin = 0.02; schizotypy , Pspin = 0.32; and PD , Pspin = 0.02. b, Dominance analysis distributes the fit of the model across input variables such that the contribution of each variable can be assessed and compared to other input variables. The percent contribution of each input variable is defined as the variableʼs dominance normalized by the total fit (R) of the model. Note that dominance analysis is not applied to the input variables of non-significant models (that is, IGE and schizotypy) and that this analysis is conducted using the Desikan–Killiany atlas because this is the only representation of ENIGMA datasets.

