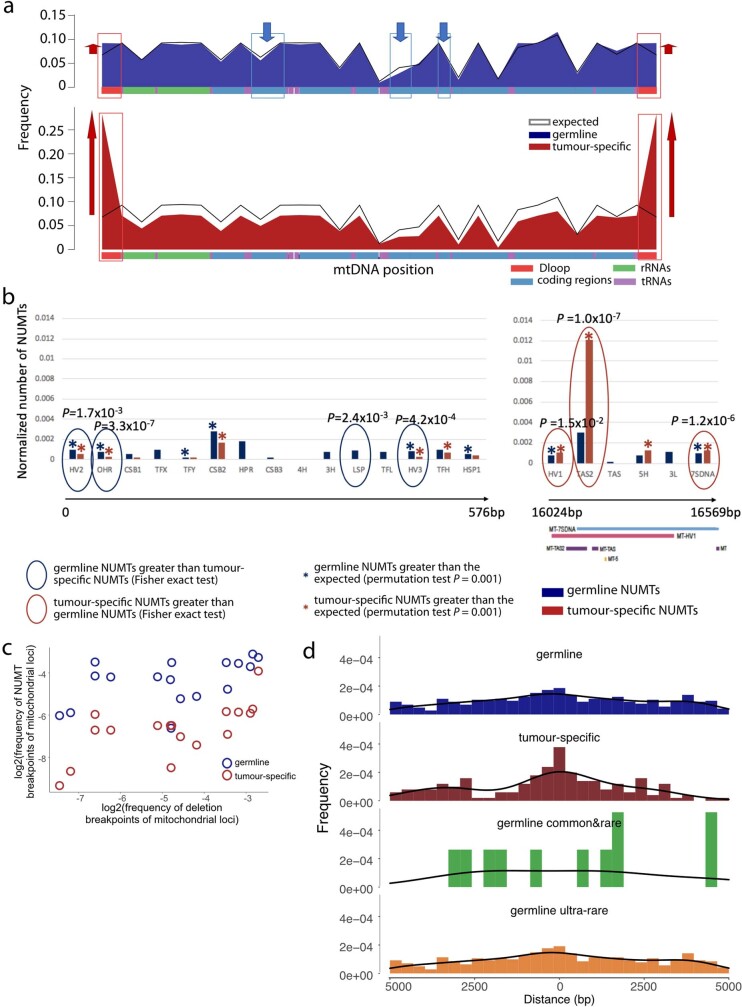
Extended Data Fig. 5. Frequency of NUMT breakpoints on mtDNA genome and the distance of NUMT location to nuclear transcription start sites (TSS).
a. Normalized frequency of NUMT breakpoints in each mtDNA region. Black lines are expected frequency. Top blue area plot shows the frequency of breakpoints from germline NUMTs. Bottom red area plot shows the frequency of breakpoints from tumour-specific NUMTs. Mitochondrial regions are shown in the different colours at the bottom of each plot. Red boxes highlight the regions where the frequencies were significantly greater than the expected by chance. Blue boxes highlighted the regions where the frequencies significantly less than the expected by chance. b. Normalized number of NUMTs within each Dloop region. Stars represent the NUMTs were significantly enriched in each region (permutation test). Circles labelled P values were from the comparison of germline and tumour-specific NUMTs (two-sided Fisher’s exact test). c. Correlation of frequencies of deletion breakpoints and NUMT breakpoints in each mtDNA region from germline and tumour-specific NUMTs. d. Histogram of distance of NUMTs location to transcription start sites (TSS). Germline, germline common & rare, ultra-rare and tumour-specific NUMTs are shown, separately.

