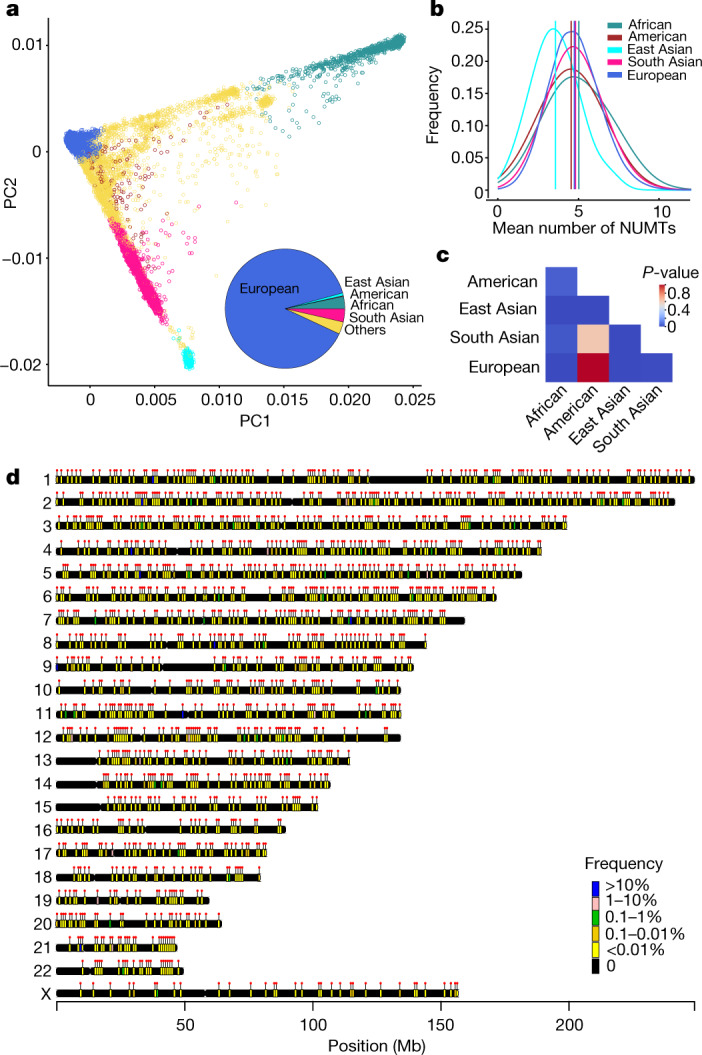
Fig. 2. NUMTs in the different populations.

a, Nuclear genotypes at common single nucleotide polymorphisms (SNPs) projected onto two leading principal components (PC1 and PC2). Individuals are coloured according to the assigned ancestry of their nuclear genome. The pie chart shows the proportion of each group overall: East Asian (cyan), South Asian (pink), African (green), American (red), European (blue) and unassigned (yellow). b, The average number of NUMTs detected in populations with different ancestries. Vertical lines show the average number of NUMTs from each population. c, Heat map showing P values from pairwise comparison of the average number of NUMTs detected between populations of different ancestries (two-sided Wilcoxon rank-sum test). d, Chromosomal locations of NUMT insertions detected in this study, coloured by the frequency of NUMTs. Dots show the locations of the NUMTs. Chromosomal locations of different NUMT insertions detected for each ancestry are shown in Extended Data Fig. 2.
