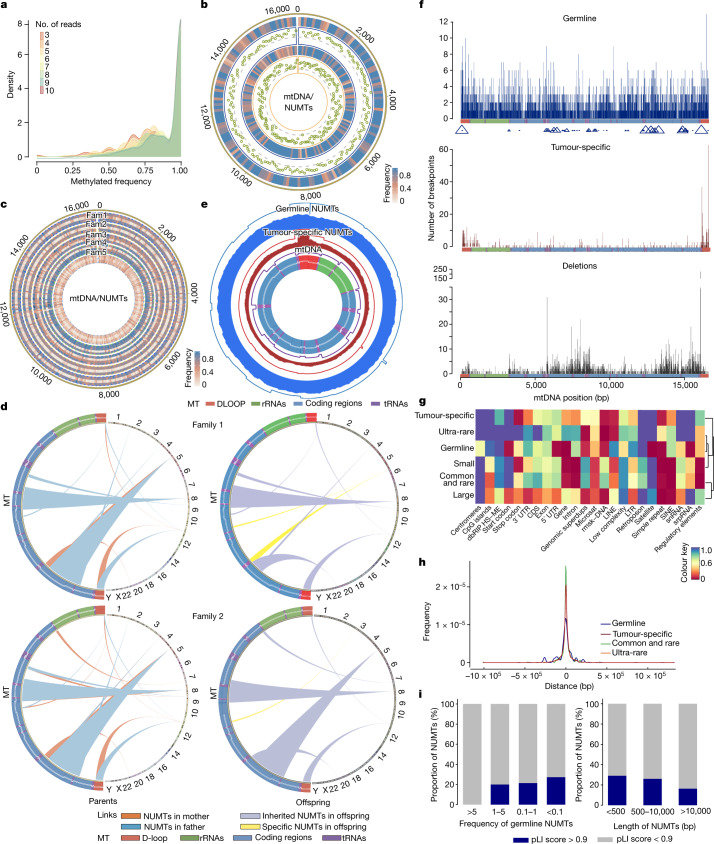
Fig. 3. Characteristics of NUMTs in humans.
a, Methylation frequency of NUMTs in 39 individuals. Colours correspond to the number of long reads that are not affected by the sequencing depth. b, Methylation status of a concatenated NUMT from a father–proband pair. From the outside: (1) methylation frequency of the concatenated NUMT in the father; (2) the ratio of methylation frequency between the NUMT and the non-methylated mtDNA sequence in the father; (3) methylation frequency of the concatenated NUMT in the proband; (4) the ratio of methylation frequency between the NUMT and the non-methylated mtDNA sequence in the proband. Green dots show methylated sites. This analysis includes only reads that were definitively nuclear in origin. The colour corresponds to the methylation frequency. c, Methylation profile for five families (fam1–fam5) with concatenated NUMTs (Supplementary Table 7). From the outside: father, mother, sibling (when available) and proband. Individuals harbouring concatenated NUMTs had higher methylation levels than the individuals without concatenated NUMTs. The colour corresponds to the methylation frequency. d, Three de novo NUMTs from two trios. e, The frequency of mtDNA insertion from germline and tumour-specific NUMTs. From the outside: (1) frequencies of breakpoints from germline NUMTs; (2) frequencies of mtDNA fragments from germline NUMTs; (3) frequencies of breakpoints from tumour-specific NUMTs; (4) frequencies of mtDNA fragments from tumour-specific NUMTs; (5) frequencies of mtDNA sequences expected by chance; (6) mtDNA regions. f, Distribution of breakpoints on mitochondrial genes with germline NUMTs, tumour-specific NUMTs and mitochondrial deletions (window size = 100 bp). The triangle size indicates the frequency of NUMTs within each window. g, P values for enrichment analysis of different genome regions (Supplementary Figs. 1–3 and Methods). Microsat, microsatellite; rmsk-DNA, repetitive DNA; snRNA, small nuclear RNA; srpRNA, signal recognition particle RNA; superdups, superduplications. h, The distance of NUMT locations from the TSS. i, The proportion of NUMTs within genes with high and low pLI scores grouped by NUMT frequency (left) and grouped by NUMT size (right).

