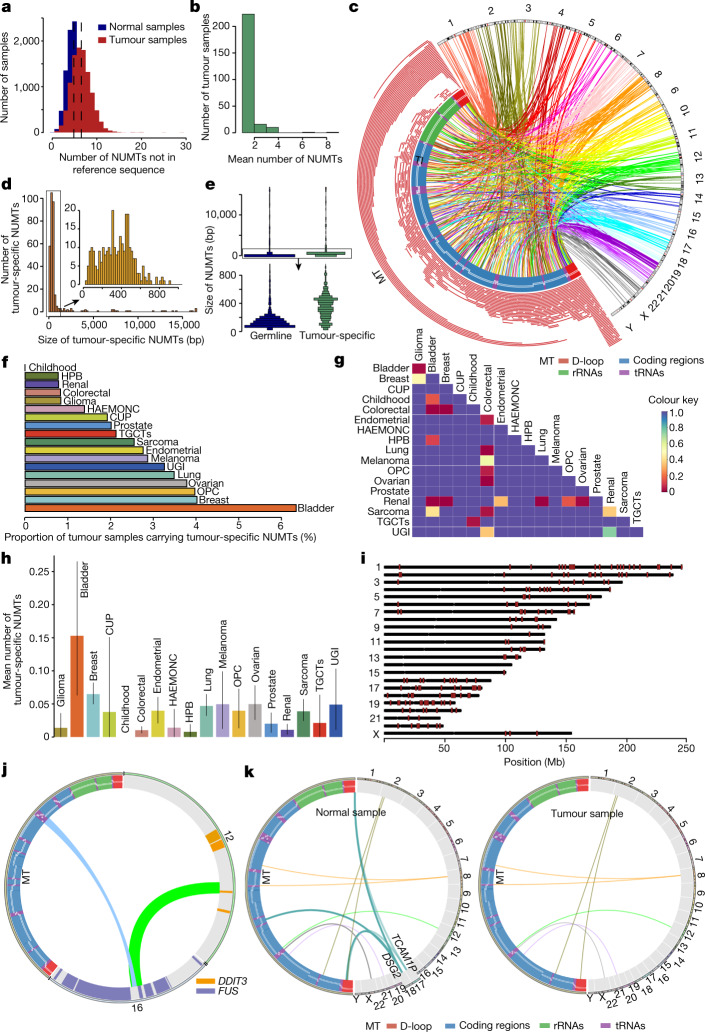
Fig. 4. NUMTs in human cancers.
a, Average number of NUMTs detected per normal and tumour sample that are not present in the reference sequence. b, Average number of tumour-specific NUMTs detected in tumours. c, Tumour-specific NUMTs detected in 12,509 normal–tumour pairs. Left, NUMT size and location on mtDNA. Links connect breakpoints between mtDNA and nuclear genomes. d, Size distribution of tumour-specific NUMTs (red) and tumour-specific NUMTs smaller than 1,000 bp (orange). e, Size distribution of all germline and tumour-specific NUMTs (top) and germline and tumour-specific NUMTs smaller than 1,000 bp (bottom). f, The percentage of different types of tumours with at least one tumour-specific NUMT. g, P values from pairwise comparison of the average number of tumour-specific NUMTs from different tumour types. h, Average number of tumour-specific NUMTs for each tumour type. Data are mean ± s.e.m. Glioma, n = 359; bladder, n = 268; breast, n = 2,038; CUP, n = 52; childhood, n = 170; colorectal, n = 1,934; endometrial, n = 579; HAEMONC, n = 72; HPB, n = 258; lung, n = 1,061; melanoma, n = 244; OPC, n = 151; ovarian, n = 423; prostate, n = 298; renal, n = 1,022; sarcoma, n = 979; TGCTs, n = 47; UGI, n = 184. i, Chromosomal locations of tumour-specific NUMTs, shown as red bars. j, NUMTs involved in FUS–DDIT3 chimeric fusion. NUMTs are shown as a blue link and the FUS–DDIT3 fusion is shown as a green link. The chromosome number and mitochondrial genome are indicated. k, Example of lost NUMTs in a breast tumour sample. The links represent NUMTs detected in either normal (left) or tumour (right) samples. The chromosome number and mitochondrial genome are indicated. CUP, carcinoma of unknown primary; endometrial, endometrial carcinoma; glioma, adult glioma; HAEMONC, haemato-oncology; HPB, hepato-pancreato-biliary cancer; melanoma, malignant melanoma; OPC, oral and oropharyngeal cancers; TGCTs, testicular germ cell tumours; UGI, upper gastrointestinal cancer.

