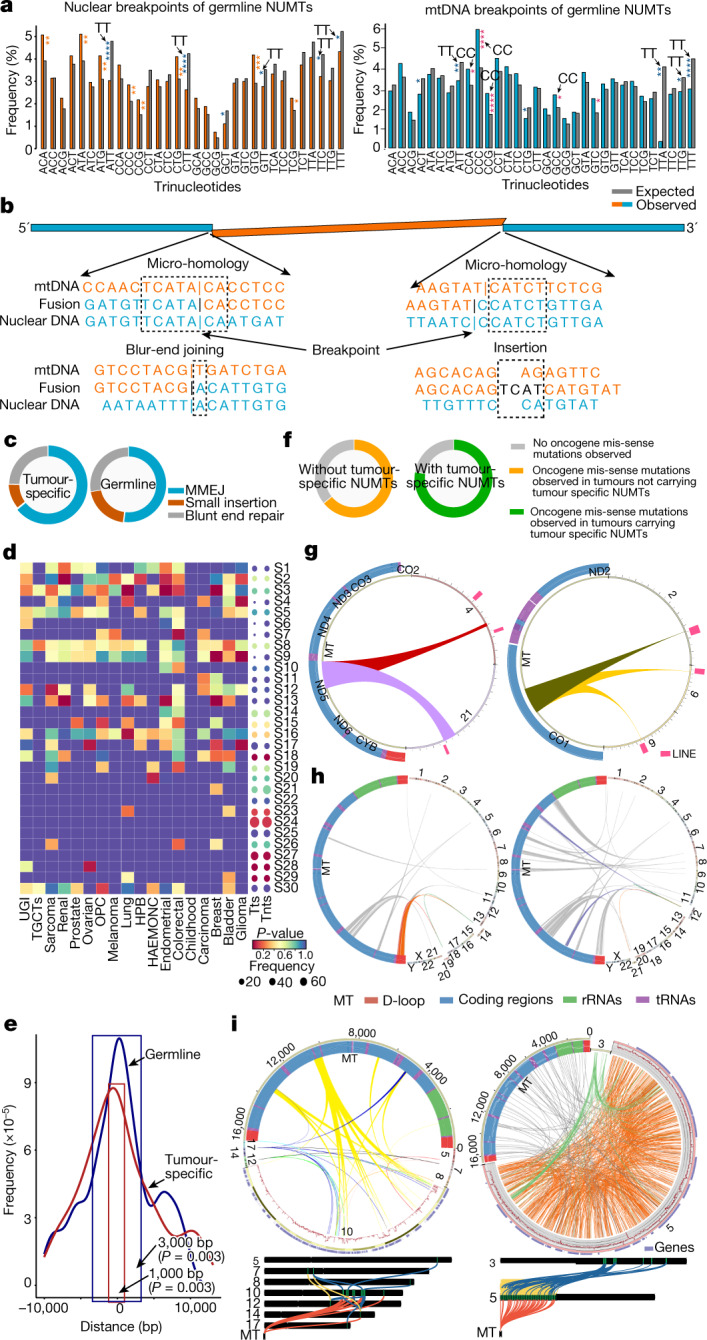
Fig. 5. Molecular mechanism of NUMT formation.

a, Trinucleotide frequencies around NUMT breakpoints in the nuclear genome (left) and mtDNA (right) (details in Extended Data Fig. 8a). Arrows point to the nCC/CCn or nTT/TTn trinucleotides significantly enriched in NUMTs. *P < 0.05, **P < 0.01, ***P < 0.001, ****P < 0.0001. b, Microhomology-mediated end joining during formation of NUMTs. c, The proportion of microhomology sequences, small insertions and blunt-end joining between nuclear and mtDNA sequences around NUMT breakpoints. d, Cancer signature enrichment for each cancer type (heat map) and all cancer types (dots). Dot size is proportional to the number of samples with each signature in tumour-specific NUMTs (Tts) and non-tumour-specific NUMTs (Tnts). e, The distance between NUMTs and PRDM9-binding sites in germline and tumour-specific NUMTs. f, NUMTs in tumours with and without missense mutations in human DNA repair genes. g, Two examples of the same mtDNA fragment detected at two locations in the nuclear genome, showing evidence that the NUMT inserted into one location and then moved to another. h, Left, an mtDNA fragment inserted into chromosome 14 and 19, and a translocation between chromosome 14 and 19. NUMTs were detected on chromosomes 14 and 19, suggesting that the NUMTs inserted into the nuclear genome before translocation occurred, then moved to another location with the translocation. Right, an mtDNA fragment inserted into chromosome 12, and a translocation between chromosome 12 and 21. NUMTs were seen on chromosome 12, but not on chromosome 21, suggesting that the NUMTs inserted into the nuclear genome after translocation occurred. i, Two examples of samples carrying mito-chromothripsis observed in this study. Circos plots show the locations of NUMTs in both nuclear and mtDNA genomes, and the structural variants in the nuclear genome. Nuclear genome sequencing depth is shown in the red line. Chromosome maps show the structural variants involved in multiple chromosomes in the nuclear genome. The read alignment from Integrated Genomics Viewer is shown in Extended Data Fig. 9c,d.
