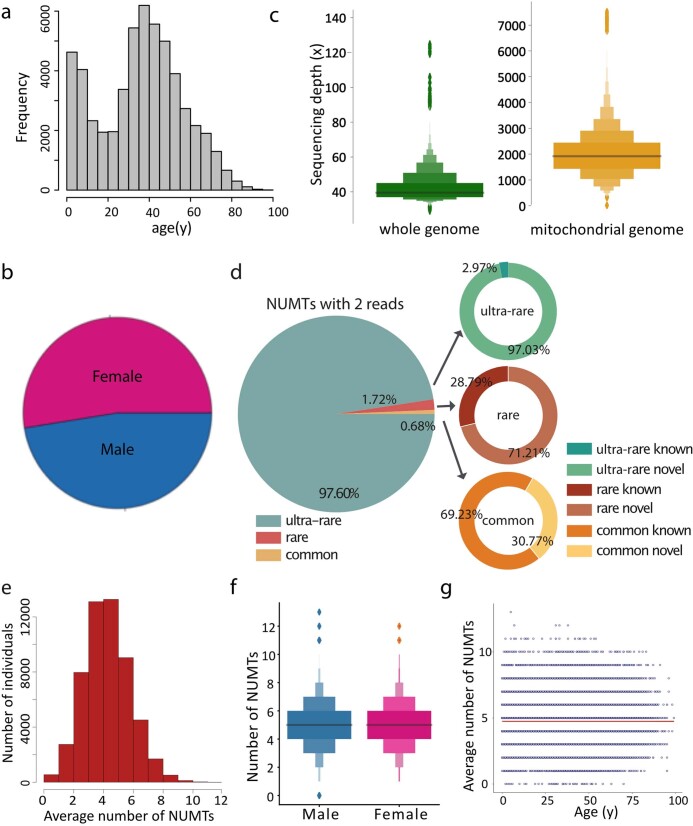
Extended Data Fig. 1. Whole genome sequencing in 53,574 individuals from the Genomics England Rare Disease Project and detected NUMT insertions.
a. Histogram of individuals’ age. b. Pie chart of individuals’ sex determined from the rare disease genomes. c. Letter-value plots of sequencing depth of whole genome sequencing (left) and mitochondrial genome sequencing (right) from the rare disease genomes. The middle line represents the median (50th percentile). Each successive level outward contains half of the remaining data. The first two sections out from the centre line contain 50% of the data. The next two sections contain 25% of the data. This continues until at the outlier level. The outliers are plotted as diamonds. d. Overview of the frequencies of the NUMTs detected by at least 2 pairs of discordant reads. Common = population frequency (F) > = 1%; rare = F < 1% but > = 0.1%; ultra-rare F < 0.1% in the population. e. Histogram of the average number of NUMTs per individual that were not present in the reference sequence and were detected by at least 2 pairs of discordant reads. f. Letter-value plots of the average number of NUMTs detected by at least 5 pairs of discordant reads from each individual, male and female shown separately. The middle line represents the median (50th percentile). Each successive level outward contains half of the remaining data. The first two sections out from the centre line contain 50% of the data. The next two sections contain 25% of the data. This continues until at the outlier level. The outliers are plotted as diamonds. g. Correlation of individual age and the average number of NUMTs detected. Regression line shown in red.

