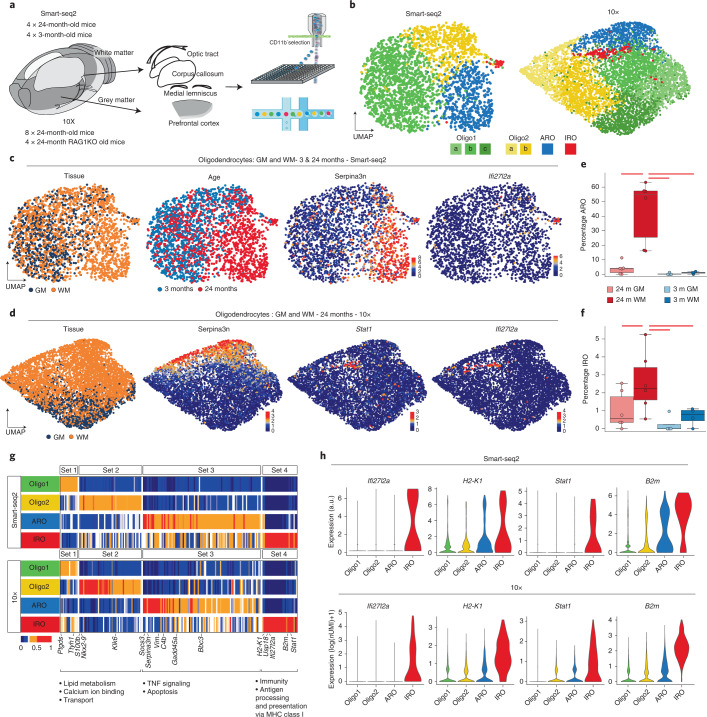
Fig. 1. Identification of age-related gene expression signatures in oligodendrocytes.
a, Experimental design from dissection to cell sorting and cell loading for the plate-based (Smart-seq2 (SS2)) and 10× pipelines, respectively. b, UMAP plots of oligodendrocytes in the SS2 and 10× datasets, colored by identified populations. c, UMAP plots of oligodendrocytes in the SS2 dataset, colored by tissue, age and expression of selected marker genes. d, The 10× dataset oligodendrocyte UMAP plots colored by tissue and expression of selected marker genes. e–f, Boxplots of the age-related oligodendrocytes (ARO) (e) and interferon-responsive oligodendrocytes (IRO) (f) cluster proportions per sample, respectively. The central line denotes the median, boxes represent the IQR and whiskers show the distribution except for outliers. Outliers are all points outside 1.5× the IQR. Each dot represents a sample (n = 20 independent experiments) and significant results (scCODA model) are indicated with red bars. 24 m, 24-month-old; 3 m, 3-month-old. g, Heatmaps of average expression of differentially expressed genes, comparing the four oligodendrocyte populations. Gene sets were identified as differentially expressed markers for each population using the SS2 dataset. Values are normalized per gene, showing the gene expression across populations. Each column represents a gene. GO terms are shown below each set of genes (Supplementary Table 3). TNF, tumor necrosis factor. h, Violin plots showing selected IRO-enriched marker genes across SS2 and 10× datasets. a.u., arbitrary units representing the corrected log(1P) (counts) value.

