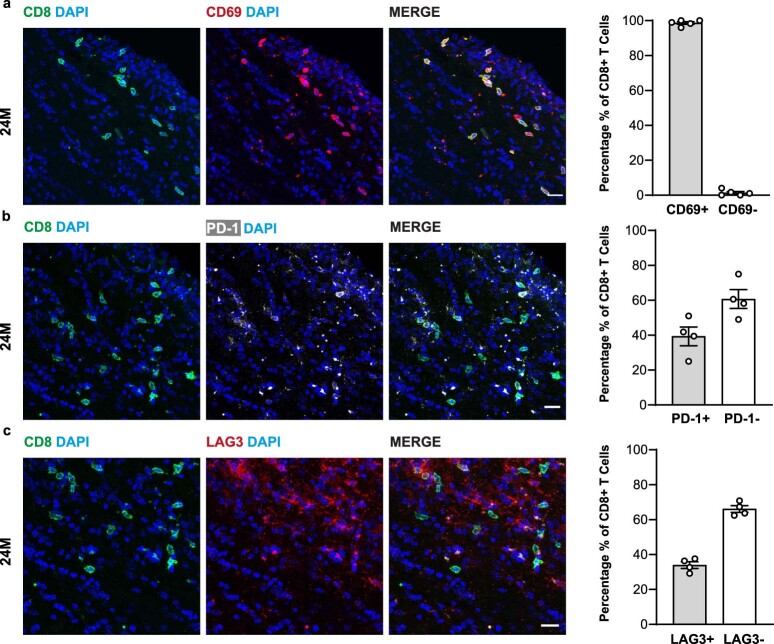
Extended Data Fig. 5. CD8 + T cells within the aged white matter express tissue-resident memory and checkpoint markers.
a, Representative confocal images of aged white matter stained for CD8 (green) with CD69 (red). Scale bar, 20 µm. Quantification of the percentage of CD8+ and CD69+ T cells in the aged white matter (three sections per mouse; 256 CD8+ T cells were analyzed from 4 mice; data are means±s.e.m). b, Representative confocal images of aged white matter stained for CD8 (green) with PD-1 (white). Scale bar, 20 µm. Quantification of the percentage of CD8+ and PD-1+ cells in the aged white matter (three sections per mouse; 237 CD8+ T cells were analyzed from 4 mice; data are means±s.e.m). c, Representative confocal images of aged white matter stained for CD8 (green) with LAG3 (red). Scale bar, 20 µm. Quantification of the percentage of CD8+ and LAG3+ cells in the aged white matter (three sections per mouse; 237 CD8+ T cells were analyzed from 4 mice; data are means±s.e.m).

