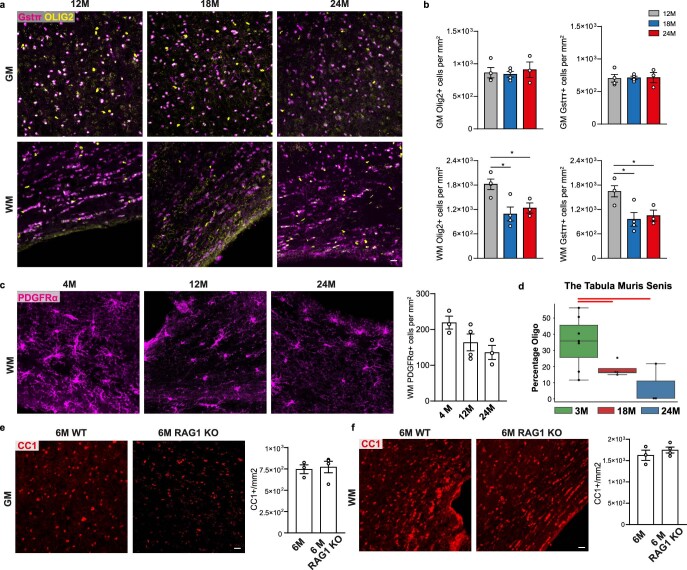
Extended Data Fig. 7. Evidence of oligodendrocyte loss in the aged white matter.
a, Immunofluorescence showing OLIG2+ oligodendrocytes lineage cells (yellow) and oligodendrocytes GSTπ+ (magenta) and in the grey and white matter of 12-, 18-, 24-month old mice. Scale bar 20 µm. b, Quantification OLIG2+ and GSTπ+ cells in the grey and white matter of 12-, 18-, 24-month old mice (for all the graphs in b, n = 4,4,3 mice per group; Olig2+ cells in WM, 12 M versus 24 M, *P = 0.0493, 12 M versus 18 M, *P = 0.0123; GSTπ+ cells in WM, 12 M versus 24 M, *P = 0.0481, 12 M versus 18 M, *P = 0.0180; data are mean±s.e.m.; P values represent two sided one-way ANOVA with post hoc Tukey test). c, Immunofluorescence showing and PDGFRα+ cells (magenta) in the white matter of 4-, 12-, 24-month old mice. Scale bar 20 µm. Quantification PDGFRα+ OPCs (magenta) in the white matter of 4-, 12-, 24-month old mice (PDGFRα+, n = 3,4,3; data are mean ± s.e.m.; P value represents two sided, one-way ANOVA with post hoc Tukey test). d, Oligodendrocytes proportion per sample (n = 14 independent experiments) in the Tabula Muris Senis dataset. The central line denotes the median, boxes represent the interquartile range (IQR), and whiskers show the distribution except for outliers. Outliers are all points outside 1.5 times of the IQR. e-f, Immunofluorescence showing CC1+ oligodendrocytes (red) in the grey matter and white matter of 6-month old wild type and Rag1−/− mice. Scale bar, 20 µm. Quantification of CC1+ oligodendrocytes in the grey matter and white matter of 6-month old wild type and Rag1−/− mice (n = 3,4 mice per group, mean ± s.e.m.).

