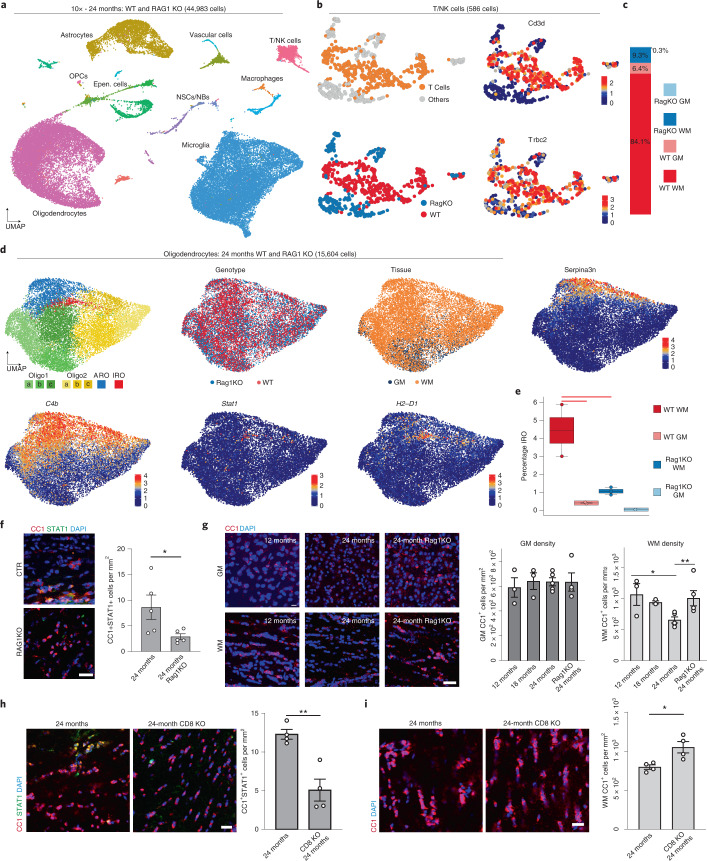
Fig. 3. Absence of functional lymphocytes reduces IFN-responsive oligodendrocyte numbers and increases oligodendrocyte cell density in the aged white matter.
a, UMAP plot of 44,983 single-cell transcriptomes, colored by major cell types. b, UMAP of T cells and NK cells, colored by T-cell identity, genotype and T-cell marker genes. c, Bar plot showing the relative distribution of each genotype-tissue experimental group within the T/NK cell population. d, UMAP plots of oligodendrocytes in the Rag1−/− and wild-type integrated dataset, colored by identified clusters, genotype and tissue annotation, as well as selected marker genes. e, Boxplot of the IRO cluster proportion per sample. The central line denotes the median, boxes represent the IQR and whiskers show the distribution except for outliers. Outliers are all points outside 1.5× the IQR. Each dot represents a sample (n = 8 independent experiments) and significant results (scCODA model) are indicated with red bars. f, Immunofluorescence staining and quantification of STAT1+CC1+ oligodendrocytes in the white matter of 24-month-old wild-type and 24-month-old Rag1−/− mice (n = 5 mice per group, *P = 0.0466; data are mean ± s.e.m.; P values represent a two-sided Student’s t-test). Scale bar, 20 µm. g, Immunofluorescence staining and quantification of CC1+ oligodendrocyte density in the gray (GM) and white matter (WM) of 12-, 18- and 24-month-old wild-type and Rag1−/− mice (GM, n = 3, 3, 5, 4; WM, n = 3, 3, 5, 4; 12 months versus 24 months, *P = 0.0185, 24-month versus 24-month Rag1−/−, **P = 0.0083; data are mean ± s.e.m.; P values represent two-sided, one-way ANOVA with post hoc Tukey’s test). Scale bar, 20 µm. h, Immunofluorescence staining and quantification of CC1+STAT1+ oligodendrocytes in the white matter of 24-month-old wild-type and CD8−/− mice (n = 4 mice per group, **P = 0.0035; data are mean ± s.e.m.; P value represents a two-sided Student’s t-test). Scale bar, 20 µm. i, Immunofluorescence staining and quantification of CC1+ oligodendrocyte density (red) in the white matter of 24-month-old wild-type and CD8−/− mice (n = 4 mice per group, *P = 0.0176; data are mean ± s.e.m.; P value represents a two-sided Student’s t-test). Scale bar, 20 µm.

