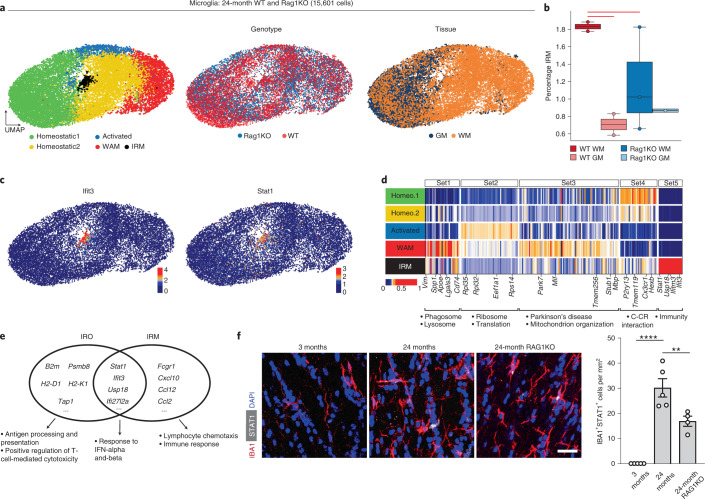
Fig. 4. Identification of IFN-responsive microglia in aged white matter.
a, UMAP plots of microglia colored by identified clusters, genotype and tissue annotation. b, Boxplot of the IRM cluster proportion per sample, respectively. WAM, White matter associated microglia; WT, Wild-type. The central line denotes the median, boxes represent the IQR and whiskers show the distribution except for outliers. Outliers are all points outside 1.5× the IQR. Each dot represents a sample (n = 8 independent experiments) and significant results (scCODA model) are indicated with red bars. c, UMAP plots of selected IRM marker genes. d, Heatmaps of average expression of differentially expressed genes, comparing the five microglia populations. Gene sets 1–4 were identified in Safaiyan et al.18 and set 5 was identified by differential expression analysis of the IRM cluster. Values are normalized per gene, showing the gene expression across populations. Each column represents a gene. GO terms are shown below each set of genes. e, Venn diagram of top 50 differentially expressed genes of IRO and IRM clusters with an intersection set of 16 genes. Gene lists are found in Supplementary Table 3. f, Immunofluorescence staining and quantification of STAT1+IBA1+ microglia in the white matter of 3- and 24-month-old wild-type and 24-month-old Rag1−/− mice (IBA1+STAT1+, n = 5,5,4; 3 months versus 24 months, ***P = 0.000002: 24-month versus 24-month Rag1−/−, **P = 0.0087; data are mean ± s.e.m.; P value represents two-sided, one-way ANOVA with post hoc Tukey’s test). Scale bar, 20 µm.

