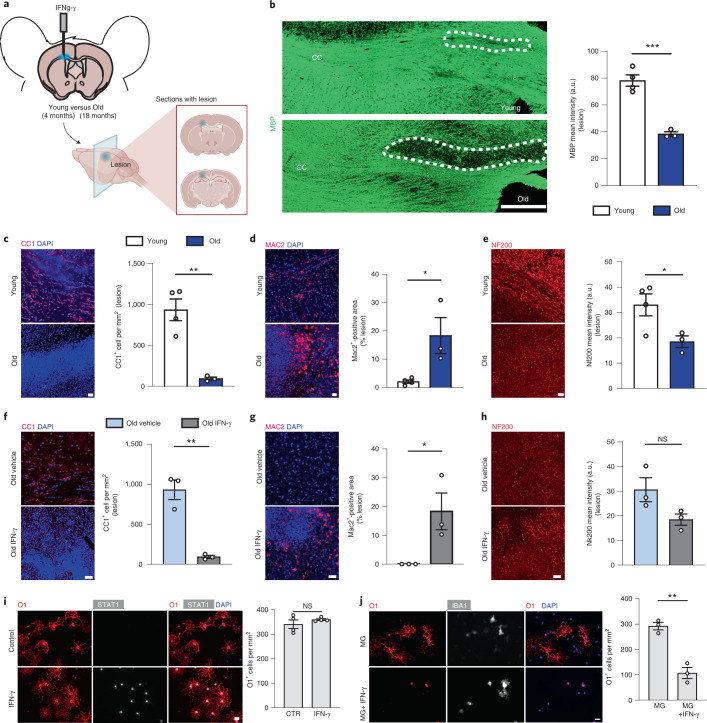
Fig. 6. IFN-γ injections induce myelin and oligodendrocyte loss in aged mice.
a, Diagram showing the model of IFN-γ injection in the corpus callosum (CC). The lesion area was identified by the positivity for monastral blue. b, Representative pictures of the CC after injection of 1 µl of a solution of 10 ng µl−1 of IFN-γ, 48 h postinjection. The intensity of the staining for MBP (green) was used to quantify the extent of demyelination (young, n = 4; old, n = 3; ***P = 0.0006; data are mean ± s.e.m.; P value represents a two-sided Student’s t-test). a.u., arbitrary units. c–e, Representative confocal images and quantifications of IFN-γ-mediated lesions in young and old mice, showing CC1+ oligodendrocytes (c), MAC2+ microglia (d) and NF200+ axons (e). The number of oligodendrocytes was expressed as number of cells per mm2; the amount of phagocytes was expressed as percentage area of the lesion occupied by MAC2+ cells; the extent of axonal damage was expressed as staining intensity of NF200 (young, n = 4; old, n = 3; CC1+, **P = 0.0031; MAC2+, *P = 0.0291; NF200+, *P = 0.0451; data are mean ± s.e.m.; P values represent a two-sided Student’s t-test). Scale bar, 20 µm. f–h, Representative confocal images and quantifications of IFN-γ-mediated lesions in old mice and of the vehicle control showing CC1+ oligodendrocytes (f), MAC2+ cells (g) and NF200+ axons (h) (n = 3 mice per group, CC1+, **P = 0.0025; MAC2+, *P = 0.0451; data are mean ± s.e.m.; P values represent a two-sided Student’s t-test). i, Representative images of cultured oligodendrocytes (labeled for O1 in red and STAT1 in white) after treatment with IFN-γ for 24 h compared with control. Quantification of the number of oligodendrocytes after IFN-γ or vehicle treatment, expressed as number of O1+ cells per mm2 (n = 4 biological replicates per group, **P = 0.0022; data are mean ± s.e.m.; P values represent a two-sided Student’s t-test). j, Representative images of oligodendrocytes cultured with microglia alone (MG) or microglia together with IFN-γ (MG+IFN-γ) and stained for O1 (oligodendrocytes) and IBA1 (microglia). Quantification of the number of oligodendrocytes, expressed as number of O1+ cells per mm2 (n = 4 biological replicates per group, **P = 0.0022; data are mean ± s.e.m.; P values represent a two-sided Student’s t-test).

