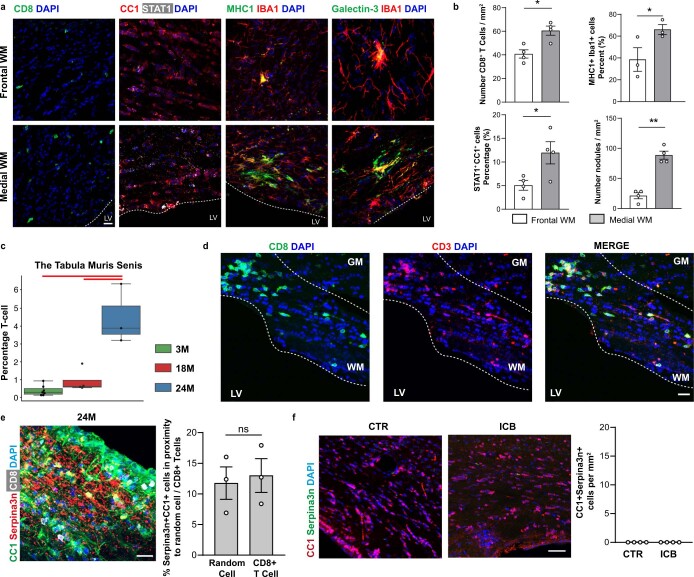
Extended Data Fig. 3. Characterization of CD8 + T cells in the aging white matter.
a, Immunofluorescence staining showing the different densities of CD8+ T cells, STAT1+CC1+ cells, MHC1+IBA1+ cells and nodules (Galectin-3+Iba1+ cell clusters) between frontal white matter away from lateral ventricles and medial white matter close to lateral ventricles. Scale bar 20 µm. b, Quantification of CD8+ T cells, STAT1+CC1+ cells, MHC1+IBA1+ cells, and nodules (Galectin-3+IBA1+ cells cluster) density difference between frontal white matter and medial white matter of 24-month old mice (for CD8+, STAT1+CC1+, and nodules, n = 4 mice per group; CD8+, *P = 0.0438; STAT1+CC1+, *P = 0.0148; nodules, **P = 0.0088; for MHC1+IBA1+, n = 3 mice per group; *P = 0.0479; data are means±s.e.m. P values represent a two-sided paried Student’s t-test). c, T cells proportion per (n = 14 independent experiments) in the Tabula Muris Senis dataset. The central line denotes the median, boxes represent the interquartile range (IQR), and whiskers show the distribution except for outliers. Outliers are all points outside 1.5 times of the IQR. d, Representative confocal images of aged white matter stained for CD3 (red) and CD8 (green). The experiment was repeated three times independently with similar results. Scale bar, 20 µm. e, Immunofluorescence image showing CD8+ T cells (white) and Serpina3n+ (red) in CC1+ oligodendrocytes (green) in the white matter of 24-month old mice. Scale bars, 20 μm. Quantification of the percentage of Serpina3n+CC1+ oligodendrocytes found around random cells (<20 µm) compared to the percentage of Serpina3n+CC1+ oligodendrocytes found around CD8+ T cells (n = 3 mice per group; data are means±s.e.m.; P value represents a two-sided paried Student’s t-test). f, Immunofluorescence showing expression of Serpina3n (green) in CC1+ oligodendrocytes (red) in the white matter of mice treated with antibodies anti PD-1 and CTLA-4 and isotype control for 6 weeks starting at an age of 18 months. Scale bar 20 µm. Quantification of CC1+ oligodendrocytes expressing Serpina3n in the white matter of mice treated with antibodies anti PD-1 and CTLA-4 and isotype control antibodies (n = 4 mice per group; data are means±s.e.m).

