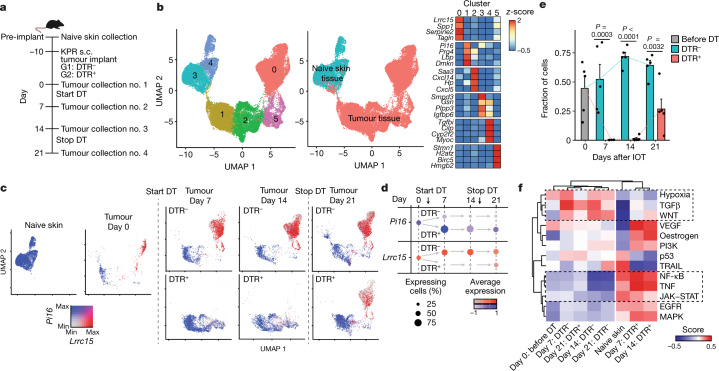
Fig. 3. Normal tissue universal fibroblast-like activity is enriched following LRRC15+ CAF depletion.
a, Experimental scheme (n = 5 mice per timepoint and group). b, UMAP plot of 37,383 single fibroblasts coloured by cluster membership (left) or coloured by tissue of origin (middle). Relative average expression of indicated marker genes across clusters from left UMAP (right). c, UMAP as in b, coloured by expression of Pi16 and Lrrc15 and split by time point and condition. d, Dot plot visualizing the percentage of positive fibroblasts (dot size) and the relative average expression (colour) for Lrrc15 and Pi16 at each time point and condition in tumour-bearing samples. e, Fraction of cells in cluster 0 of each treatment group (n = 5 mice per group) at all four time points in tumour-bearing samples. f, PROGENy pathway enrichment scores (colour) for cells pooled for each of the indicated time points and conditions (bottom row). Data in e are the mean + s.e.m., and statistics were calculated using two-tailed, unpaired Student’s t-test.

