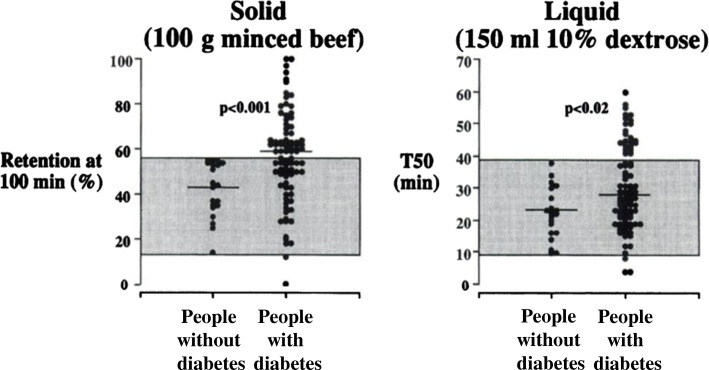
Fig. 1.
Gastric emptying of solid (100 g minced beef, per cent retention at 100 min) and liquid (150 ml 10% dextrose, half-emptying time [T50]) nutrients in 86 participants with long-standing diabetes (66 with type 1 diabetes, 20 with type 2 diabetes) and 20 healthy participants. Horizontal lines represent median values. The range of gastric emptying rates in the healthy participants is represented by the shaded area. Adapted from Jones et al [8] © SNMMI. This figure is available as part of a downloadable slideset

