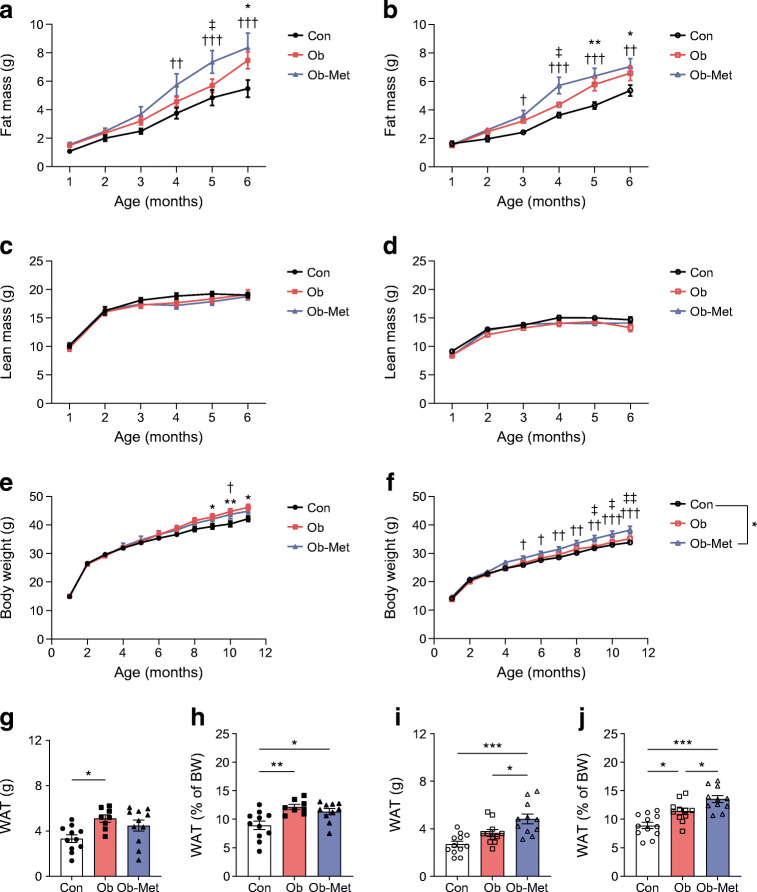
Fig. 2.
Mouse offspring body composition. (a–d) Fat mass (a, b) and lean mass (c, d) of male (a, c) and female (b, d) offspring until 6 months of age by TD-NMR. Numbers are n=9–12 (male Con), n=9–12 (male Ob), n=9–11 (male Ob-Met), n=11 or 12 (female Con), n=10–12 (female Ob) and n=11 or 12 (female Ob-Met) independent litters per group. (e, f) Body weight of male (e) and female (f) offspring until 12 months of age (n=12 independent litters per group; data are littermate means). *p<0.05 and **p<0.01, Con vs Ob; †p<0.05, ††p<0.01 and †††p<0.001, Con vs Ob-Met; ‡p<0.05 and ‡‡p<0.01 Ob vs Ob-Met (two-way ANOVA with Tukey’s multiple comparison test). (g–j) total weight of WAT depots collected at 12 months of age in male (g, h) and female (i, j) offspring in absolute terms and relative to offspring body weight (n=10–12 independent litters per group except for n=8 for male Ob group). An outlier was excluded from (g) male Ob-Met (ROUT method, outlier excluded value 4.71 g). *p<0.05, **p<0.01 and ***p<0.001 (one-way ANOVA with Tukey’s multiple comparison test). Black circles, Con (offspring of control-fed dams); pink squares, Ob (offspring of obese dams); blue triangles, Ob-Met (offspring of obese metformin-treated dams); closed symbols, male offspring; open symbols, female offspring. BW, body weight

