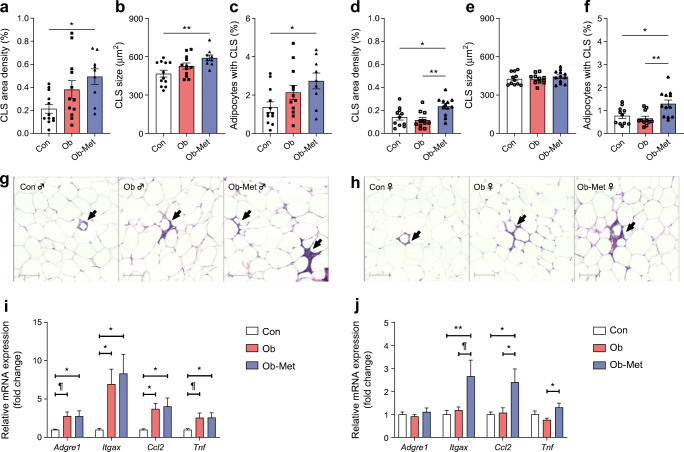
Fig. 3.
Immune cell infiltration and inflammation in 12-month-old mouse gonadal adipose tissue. (a–h) Immune cell infiltration into gWAT of 12-month-old male (a–c) and female (d–f) offspring as assessed by the presence of CLS as seen on the representative images for male (g) and female (h) offspring (n=9–12 independent litters per group). Scale bar, 100 μm. Area density of CLS in WAT (a, d), CLS size (b, e) and percentage of adipocytes surrounded by CLS (c, f) are shown. (i, j) mRNA expression of macrophage markers and proinflammatory genes in gonadal WAT of 12-month-old male (i) and female (j) offspring relative to the expression of Ppia (fold change using the comparative Ct method) and expressed relative to Con offspring (n=11 or 12 independent litters except for n=8 male Ob offspring). Outliers were excluded as follows: from (i) Adgre1, Cd1c and Ccl2 for male Con (Grubb’s method, outlier excluded values 2.178-, 7.088- and 2.391-fold, respectively); from (j) Ccl2 and Tnf for female Ob (Grubb’s method, outlier excluded values 4.790- and 2.440-fold, respectively); and from (j) Itgax for one female Con and one female Ob (Grubb’s method, outlier excluded values 4.059- and 3.671-fold, respectively). *p<0.05 and **p<0.01; ¶0.05<p<0.10 (one-way ANOVA with Tukey’s multiple comparison test). Circles, Con (offspring of control-fed dams); squares, Ob (offspring of obese dams); triangles, Ob-Met (offspring of obese metformin-treated dams); closed symbols, male offspring; open symbols, female offspring

