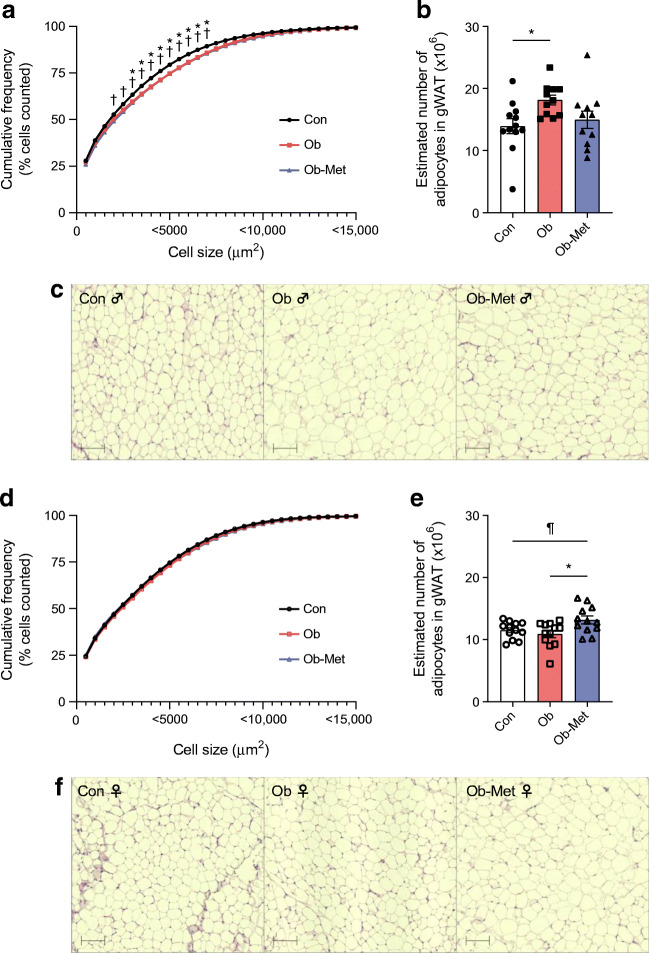
Fig. 4.
Cellularity of 12-month-old mouse offspring gWAT. (a, d) Cumulative frequency distribution of gonadal adipocyte size in male (a) and female (d) offspring shown as a curve reflecting the percentage of cells that falls below a particular adipocyte size, with representative images of H&E-stained sections for male (c) and female (f) offspring (n=11 or 12 independent litters per group). Scale bar, 100 μm. *p<0.05 for Con vs Ob; †p<0.05 for Con vs Ob-Met; ¶0.05<p<0.10 (two-way ANOVA with Tukey’s multiple comparison test). (b, e) Estimated adipocyte number in the collected gWAT depot for male (b) and female (e) offspring. An outlier was excluded in (b) from male Ob-Met (Grubb’s method, outlier excluded value 3.27×10⁶ cells). *p<0.05 (one-way ANOVA with Tukey’s multiple comparison test). Black circles, Con (offspring of control-fed dams); pink squares, Ob (offspring of obese dams); blue triangles, Ob-Met (offspring of obese metformin-treated dams); closed symbols, male offspring; open symbols, female offspring

