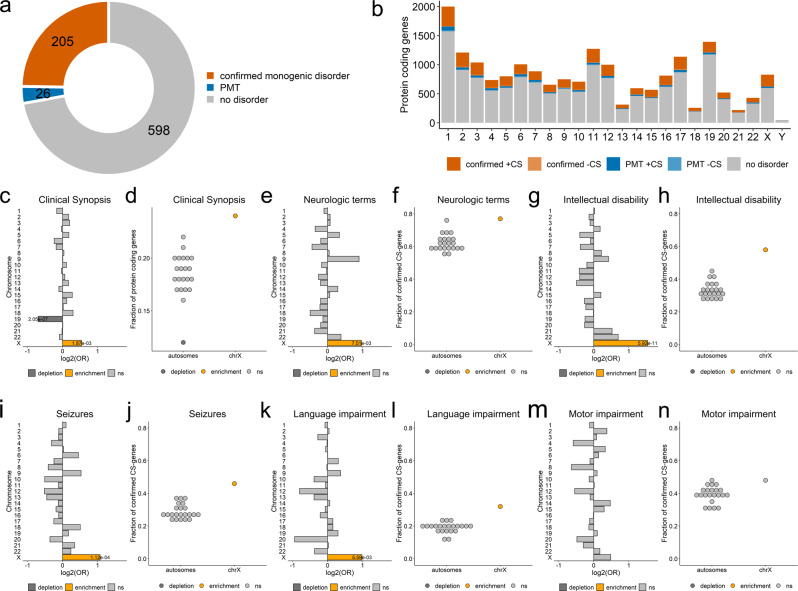
Fig. 1. Disorder genes across chromosomes.
a Number of protein-coding genes on chrX. Genes associated with at least one monogenic disorder: orange, confirmed genes; blue: genes with provisional associations (P), associated with susceptibility factors to multifactorial disorders (M) or traits (T) (altogether: PMTs); grey: genes without known phenotypes (no-disorder genes). b Number of protein-coding genes per chromosome. Dark and light colors represent genes with Clinical Synopsis (CS) data for at least one of the associated phenotypes (+CS) or without CS (-CS), respectively. c Per chromosome enrichment/depletion of protein-coding genes with at least one associated phenotype comprising Clinical Synopsis data (confirmed CS-genes). d Fraction of confirmed CS-genes among protein-coding genes. e–n. Predominance of chrX genes associated with neurologic features. e, g, i, k and m, Per chromosome enrichment/depletion of genes with non-specific neurologic features (e), intellectual disability (g), seizures (i), language impairment (k), or motor development (m). f, h, j, l and n, Fraction of genes associated with non-specific neurologic features (f), intellectual disability (h), seizures (j), language impairment (l), or motor development (n). c–n, Yellow, enrichment; dark-grey, depletion; light grey, not significant (ns). Terms corresponding to the same neurological clinical features were used in OMIM searches (Supplementary Data 3). Only significant p-values are shown (Fisher’s test (two-sided) followed by Bonferroni correction for multiple testing across both chromosomes and phenotypes). a–n Source data are provided as a Source Data file.

