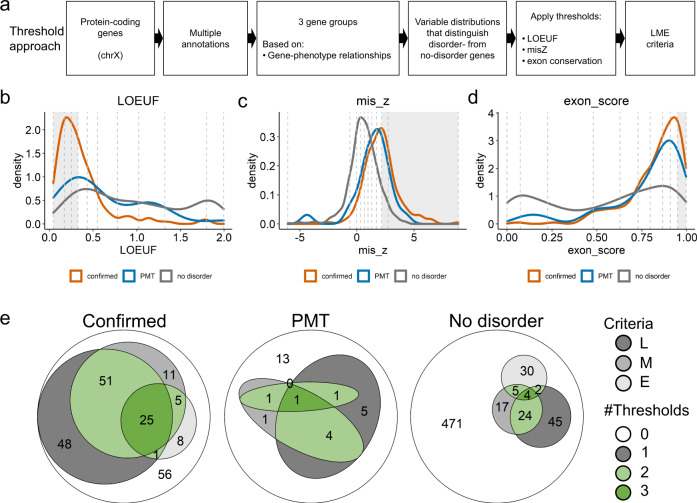
Fig. 3. Features shared by known disorder genes.
a Overview of the approach used to uncover features shared by disorder genes (details in Methods). Density plots showing the distribution of LOEUF (b), misZ (c) and exon-conservation score (d) according to gene group. Confirmed disorder genes (orange), PMT genes (blue), no-disorder genes (grey). Vertical dashed lines separate deciles of the overall distribution. Grey areas depict deciles for which confirmed disorder-associated genes are enriched (related to Supplementary Fig. 2). e Euler diagrams showing the number of genes fulfilling LOEUF (L), misZ (M) and exon-conservation (E) criteria for confirmed (left), PMT (middle) and no-disorder genes (right). Thresholds: LOEUF ≤ 0.326, misZ ≥ 2.16, exon-conservation score ≥ 0.9491. Genes fulfilling at least two LME criteria are shown in green (light or dark green for two or three criteria, respectively). Genes meeting only one of the metrics are shown in different shades of grey (dark to light: LOEUF, misZ, exon-conservation). Genes not meeting LME criteria are shown in white. b–e, Source data are provided as a Source Data file.

