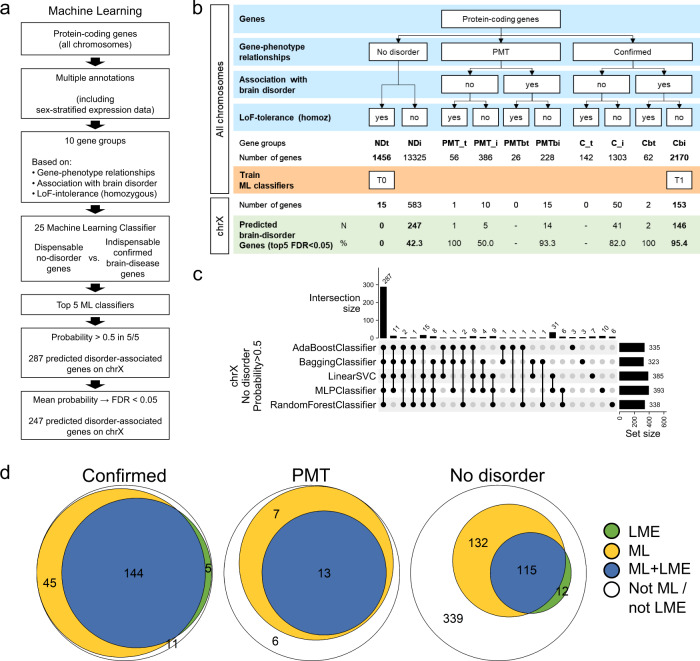
Fig. 4. Machine learning predicts putative disorder genes.
a Overview of the machine learning approach used to predict disorder genes (details in Methods). b Protein-coding genes were pre-classified into 10 subgroups based on (1) the type of associations with disorders and/or traits (confirmed, PMT, no-disorder), (2) the association with a brain disorder, and (3) the tolerance to loss-of-function (LoF) homozygous variants. Two classes were used to train the 25 machine learning classifiers: Cbi (confirmed brain-disorder associated genes that are LoF-homozygous intolerant; value 1.0) and NDt (no-disorder genes tolerant to LoF-homozygous mutations; value 0). We show number and fraction of predicted genes for each of the 10 classes for chrX (FDR < 0.05 of the mean probability of the top five ML classifiers: AdaBoostClassifier, BaggingClassifier, LinearSVC, MLPClassifier, and RandomForestClassifier). Data underlying this scheme can be found in Supplementary Data 6. c Upset plot showing the number of genes predicted by each of the top five ML classifiers (set size) and the number of genes shared between classifiers (intersection size). d Euler diagrams showing the number of genes fulfilling LME criteria (LME, green), predicted by the ML approach (yellow) or both (blue) for confirmed (left), PMT (middle) and no-disorder genes (right). Genes not predicted by the ML approach are shown in white. c, d Source data are provided as a Source Data file.

