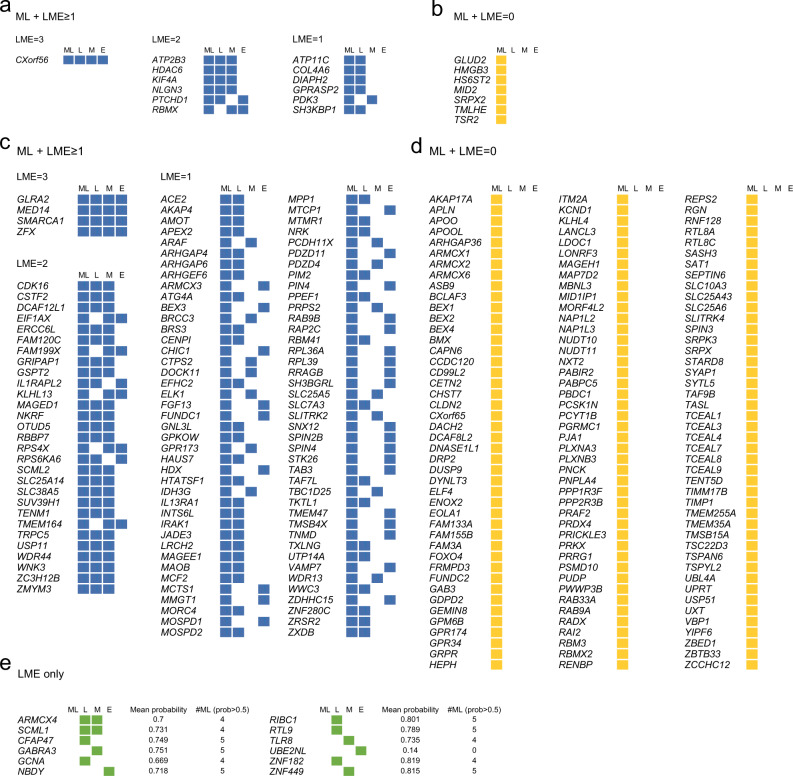
Fig. 5. Different evidence strength for the predicted disorder-associated genes.
PMT (a, b) and no-disorder genes (c, d) predicted by the ML-classifiers as possibly disease-associated, either fulfilling (a, c) or not LME criteria (b, d). e No-disorder genes meeting LME criteria but not predicted by the ML-classifiers. Values show for each gene the mean probability of the five ML-classifiers and the number of ML-classifiers showing probability > 0.5. a–e Blue, genes predicted by the ML approach and fulfilling at least one LME criteria; yellow, genes predicted by the ML approach; green, genes fulfilling only LME criteria. Data underlying this scheme can be found in Supplementary Data 8.

