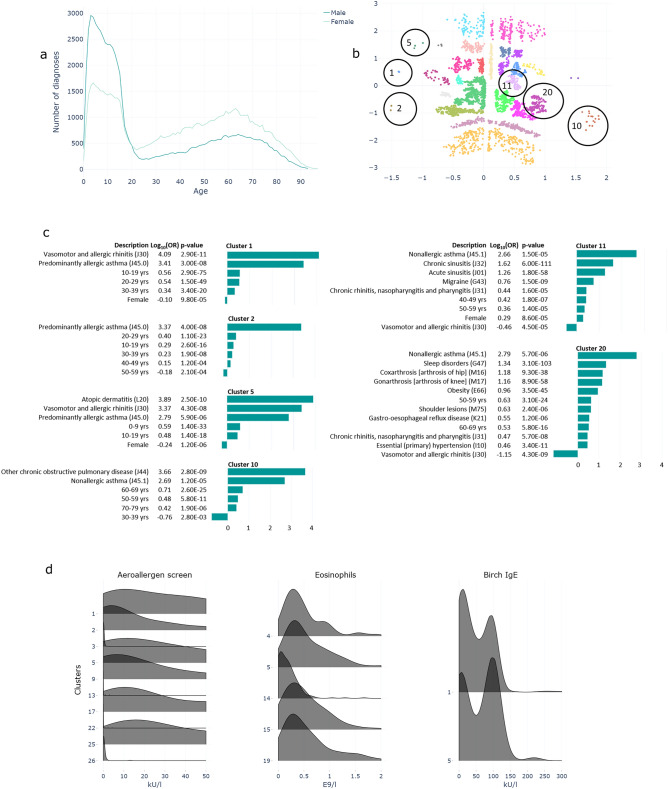
Figure 3.
Asthma. (a) Age and sex-distribution of diagnoses among patients in secondary and tertiary care. (b) Heterogeneity of asthma patients in 27 clusters represented in two-dimensional latent space of VAE model. Clusters mentioned in the text are circled. (c) Cluster-specific characteristics presented by statistically significant logarithmic odds ratios for demographics and diagnoses. (d) Distributions of laboratory results that differ statistically significantly (FDR 0.1%) between a specific cluster and the rest of the patients (only selected tests shown).

